
1,700 Words / 7 min. Read
In February 2023, the U.S. Climate Vulnerability Index (CVI) was released, cataloging more than 184 indicators and datasets along with an interactive map of its findings.1 The CVI often shows up in web searches for climate risk maps and phrases like “best places to live for climate change,” and we’ve seen it recommended as a resource for people looking for a safer place to move to.
If you don’t like the term “climate haven,” that’s understandable; we’ve written about that here. We can’t escape the effects of climate change, nor should we use adaptation as an excuse to keep emitting and consuming beyond our means. We’re using that term to mean a town, city, or region that’s projected to experience less risk from climate-fueled crises, specifically extreme weather and natural disasters.
If that’s what you’re looking for, the CVI seems like a magic bullet; just filter by lowest vulnerability, and pick a town or city in those counties! But as we dove a little deeper into the data, we found there are some big caveats, especially if your goal is to find a safer place to call home. So let’s take a look at those, and how we can use this tool in our search for resilient regions.
Data & Methodology
One big key that the CVI isn’t intended for risk assessment is in its FAQ, where its authors directly state that:
No, the CVI is not a risk assessment. It is an environmental justice screening and mapping tool that uses data to show disparities across the United States in order to pinpoint where efforts and resources could be prioritized to create climate resilience.
The CVI does not predict the likelihood or frequency of specific disasters. The tool combines data about past events with future predictions from scientists if significant reductions in climate pollution are not made to address our warming planet. The CVI’s rankings are intended to show communities and policymakers where resources are most urgently needed - and why.2
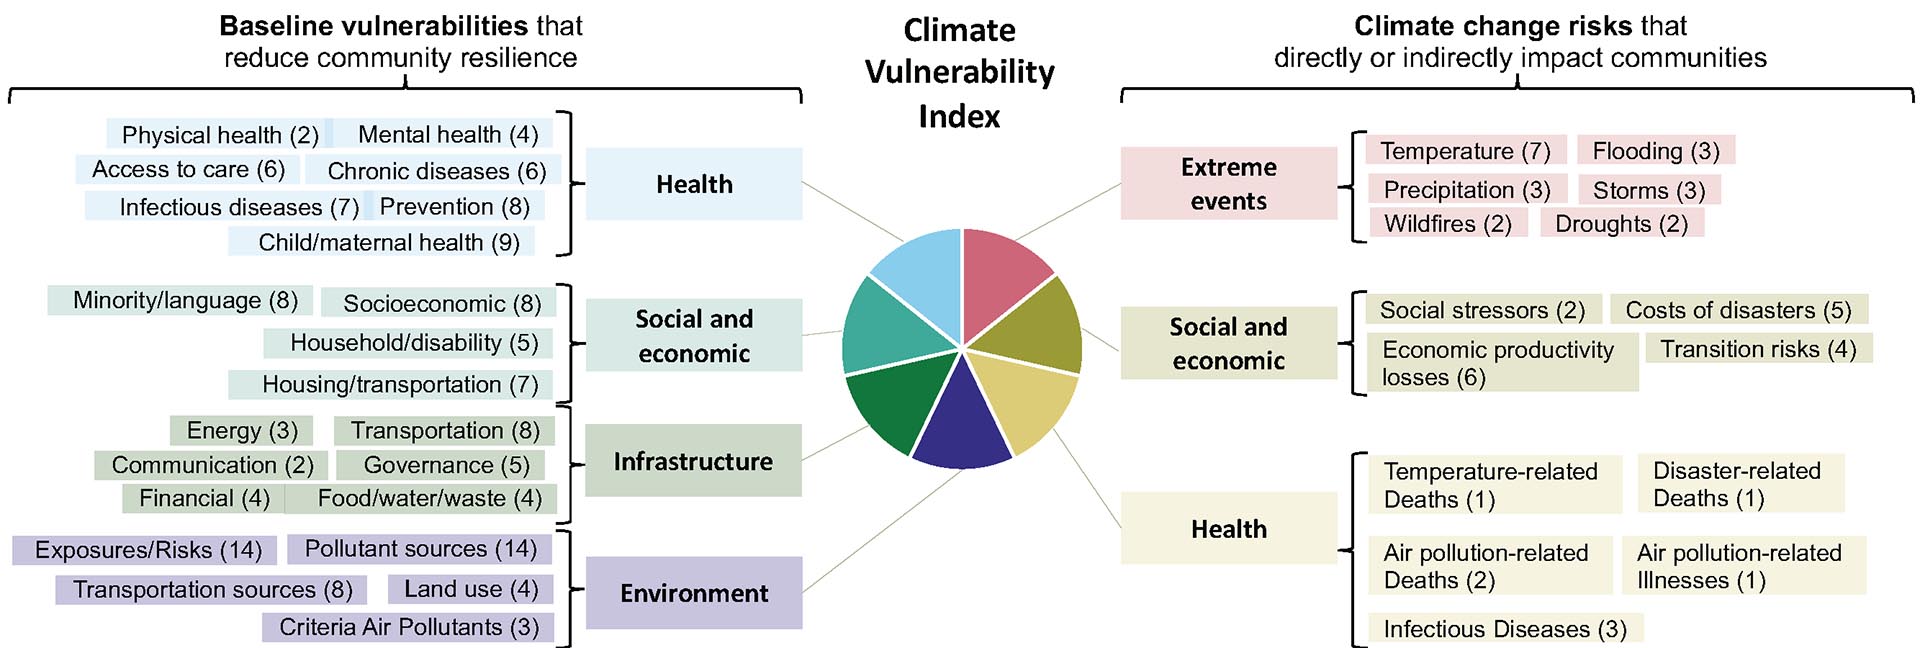
Most people will be primarily concerned about avoiding extreme weather and natural disasters; the CVI’s methodology page implies that physical risks only comprise about 30% of its vulnerability score:1
Furthermore, most of its data for physical risk comes from the National Risk Index:
Over half of the Baseline Social & Economic indicators rely on previous compilations from the CDC Social Vulnerability Index (Agency for Toxic Substances and Disease Registry, 2018), and all but one of the Climate Change Extreme Events indicators rely on IPCC or the FEMA National Risk Index; other domains have more diverse sources of data.1
For these reasons, we don’t recommend using the Climate Vulnerability Index as a tool to assess your physical risk. Instead, look for maps which directly address specific risk factors (such as we’ve compiled in our free collection). You can also go to the National Risk Index to view that data directly, although that comes with some caveats as well.
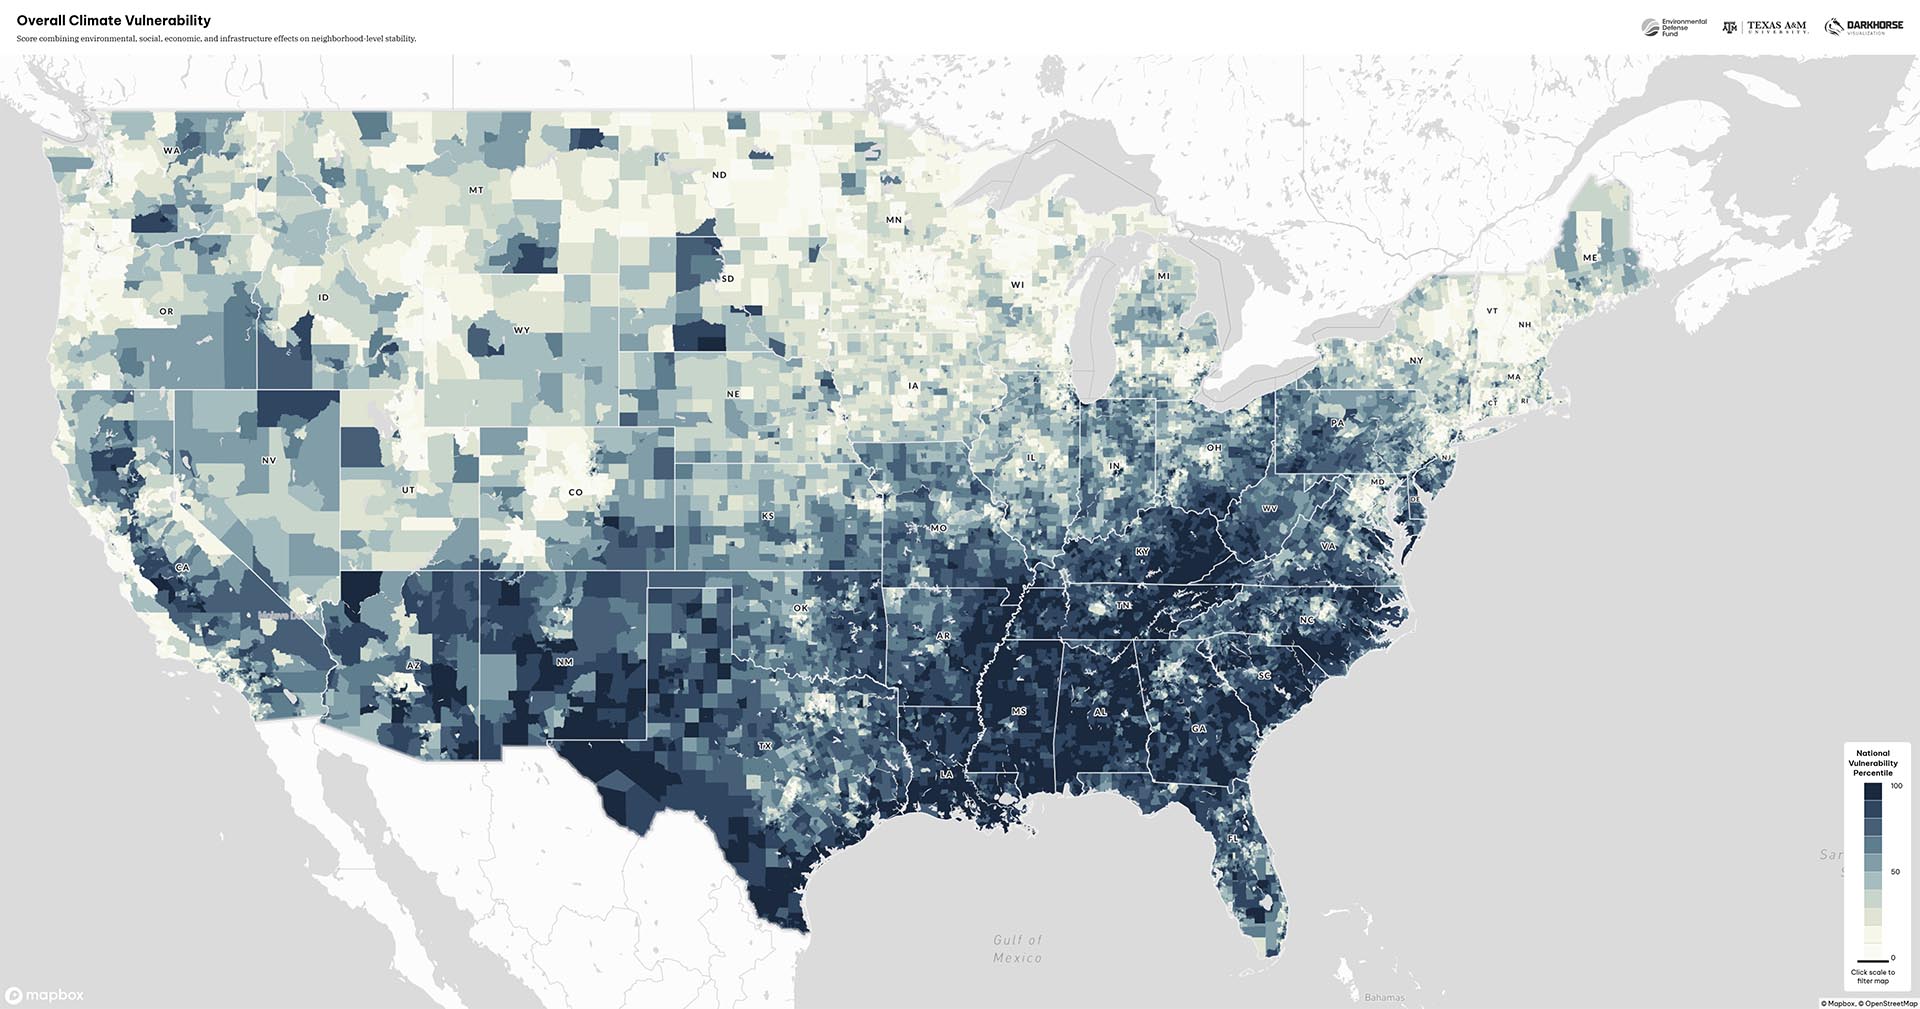
With that, let’s take a closer look at the 2 primary layers of the CVI: Climate Impacts, and Community Baseline.
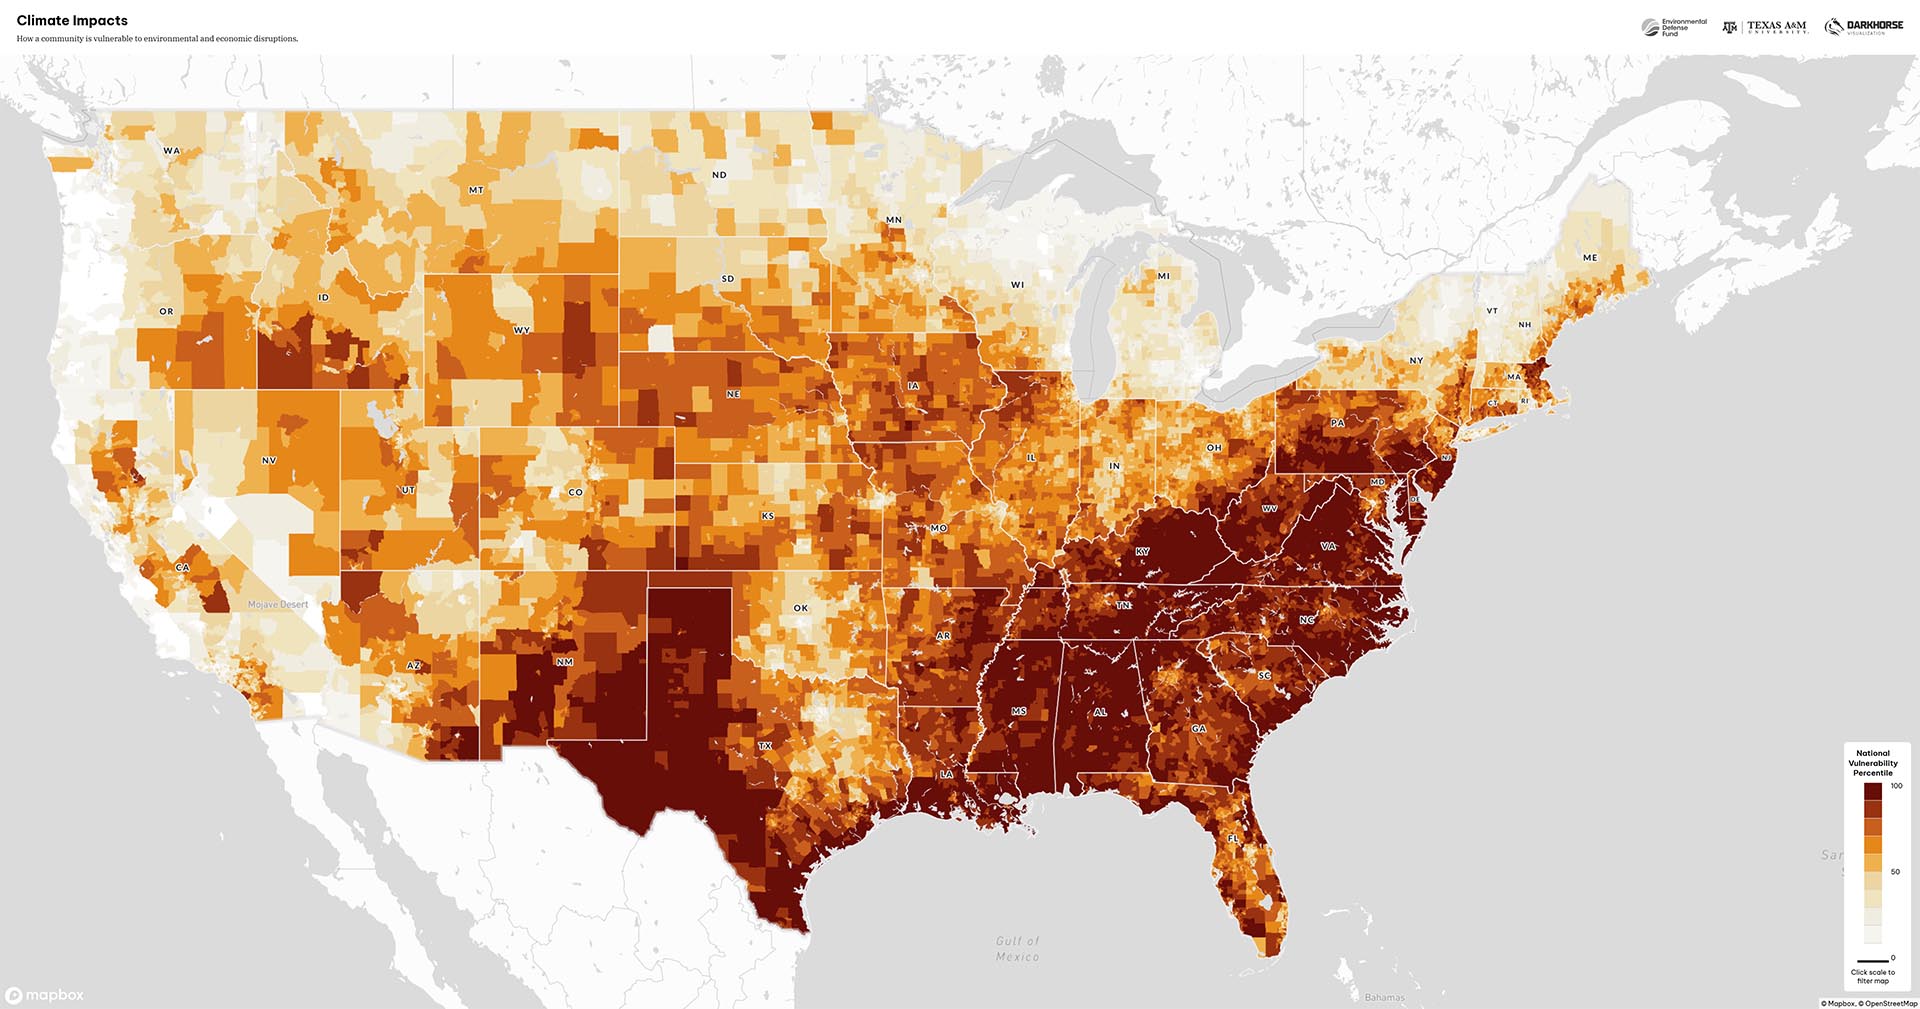
Climate Impacts
The Climate Impacts layer of the CVI is intended to assess direct risk from climate change; this layer is further divided into health, social & economic, and extreme events. Overall, it shows the Southeastern and Southwestern US as most vulnerable, which we’ve found to be true as well.
However, when we select Extreme Events on the map, we see that much of the Southeastern US is shown as a low-vulnerability region:
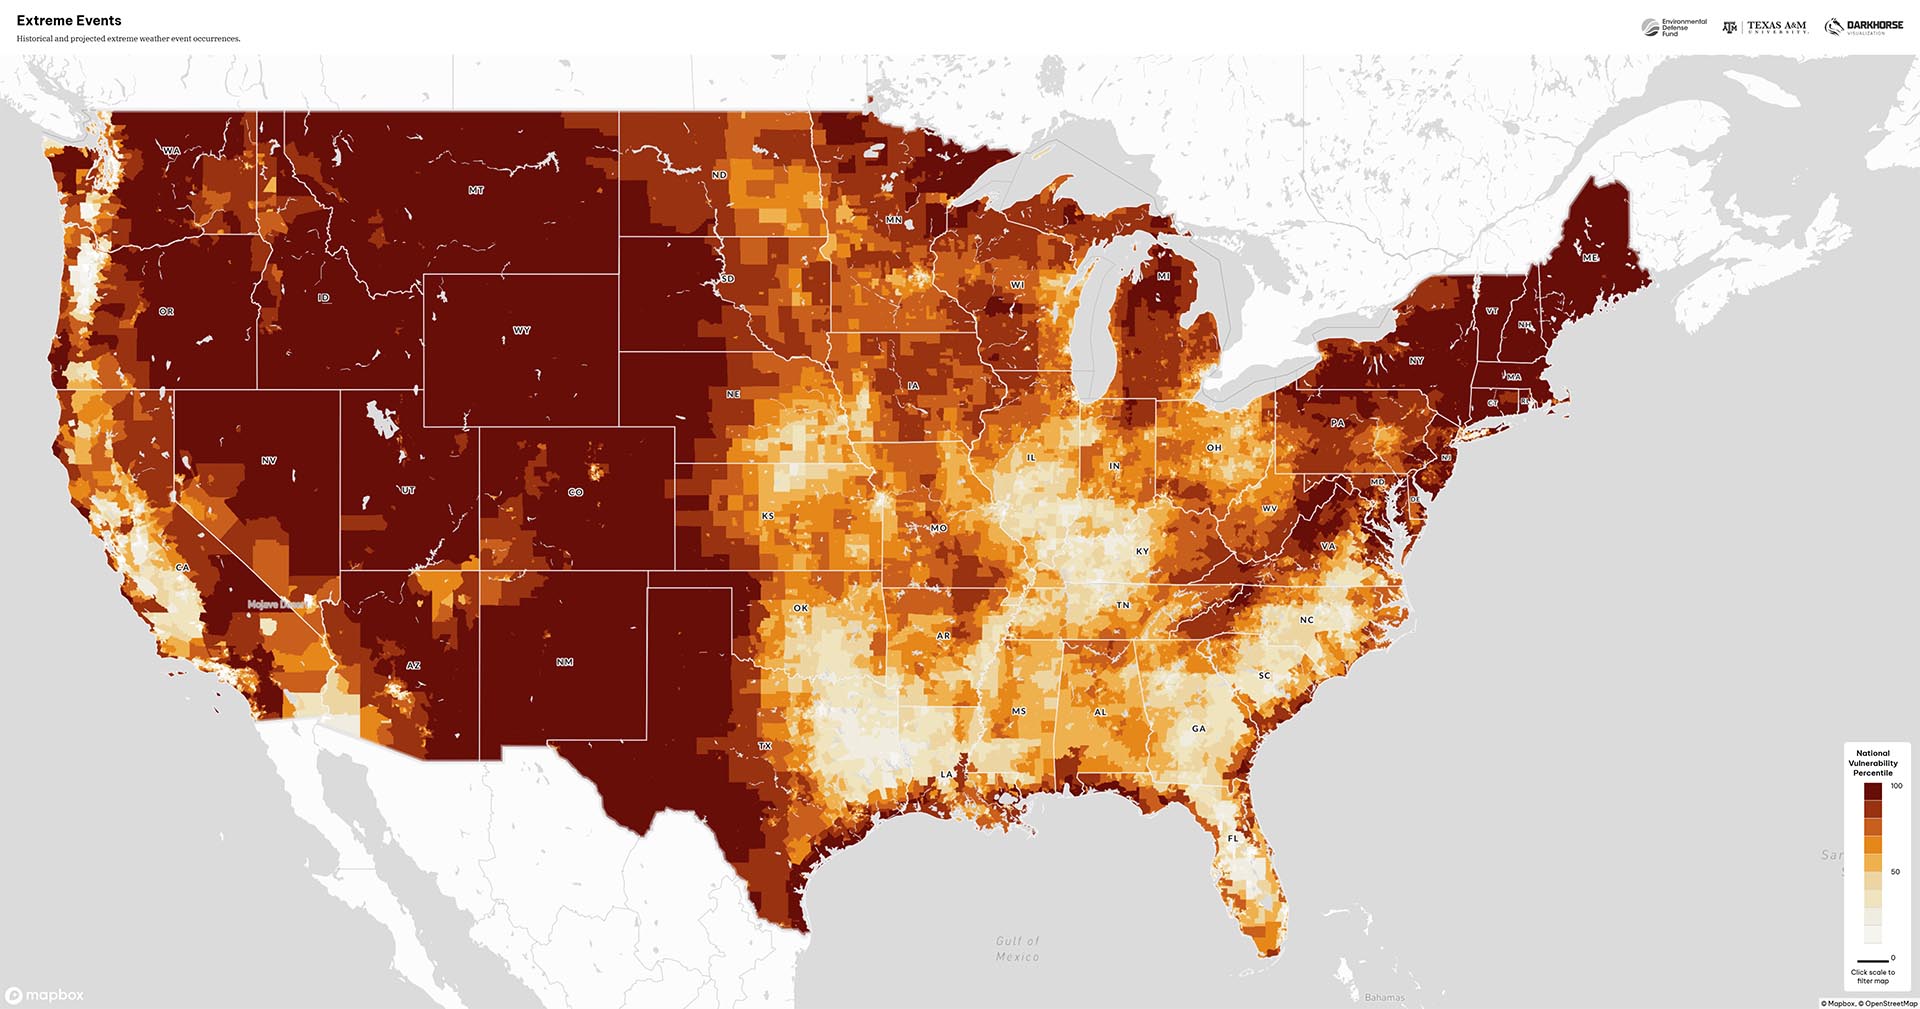
This contradicts the data we’ve seen on climate risk, which almost universally finds that the Southeastern US is one of the most vulnerable regions of America when it comes to extreme weather and natural disasters.
Without knowing the weighting of the data it’s hard to know how they arrived at this result, but it may be partly due to the fact that the CVI’s risk rating for temperature includes both heat and cold:
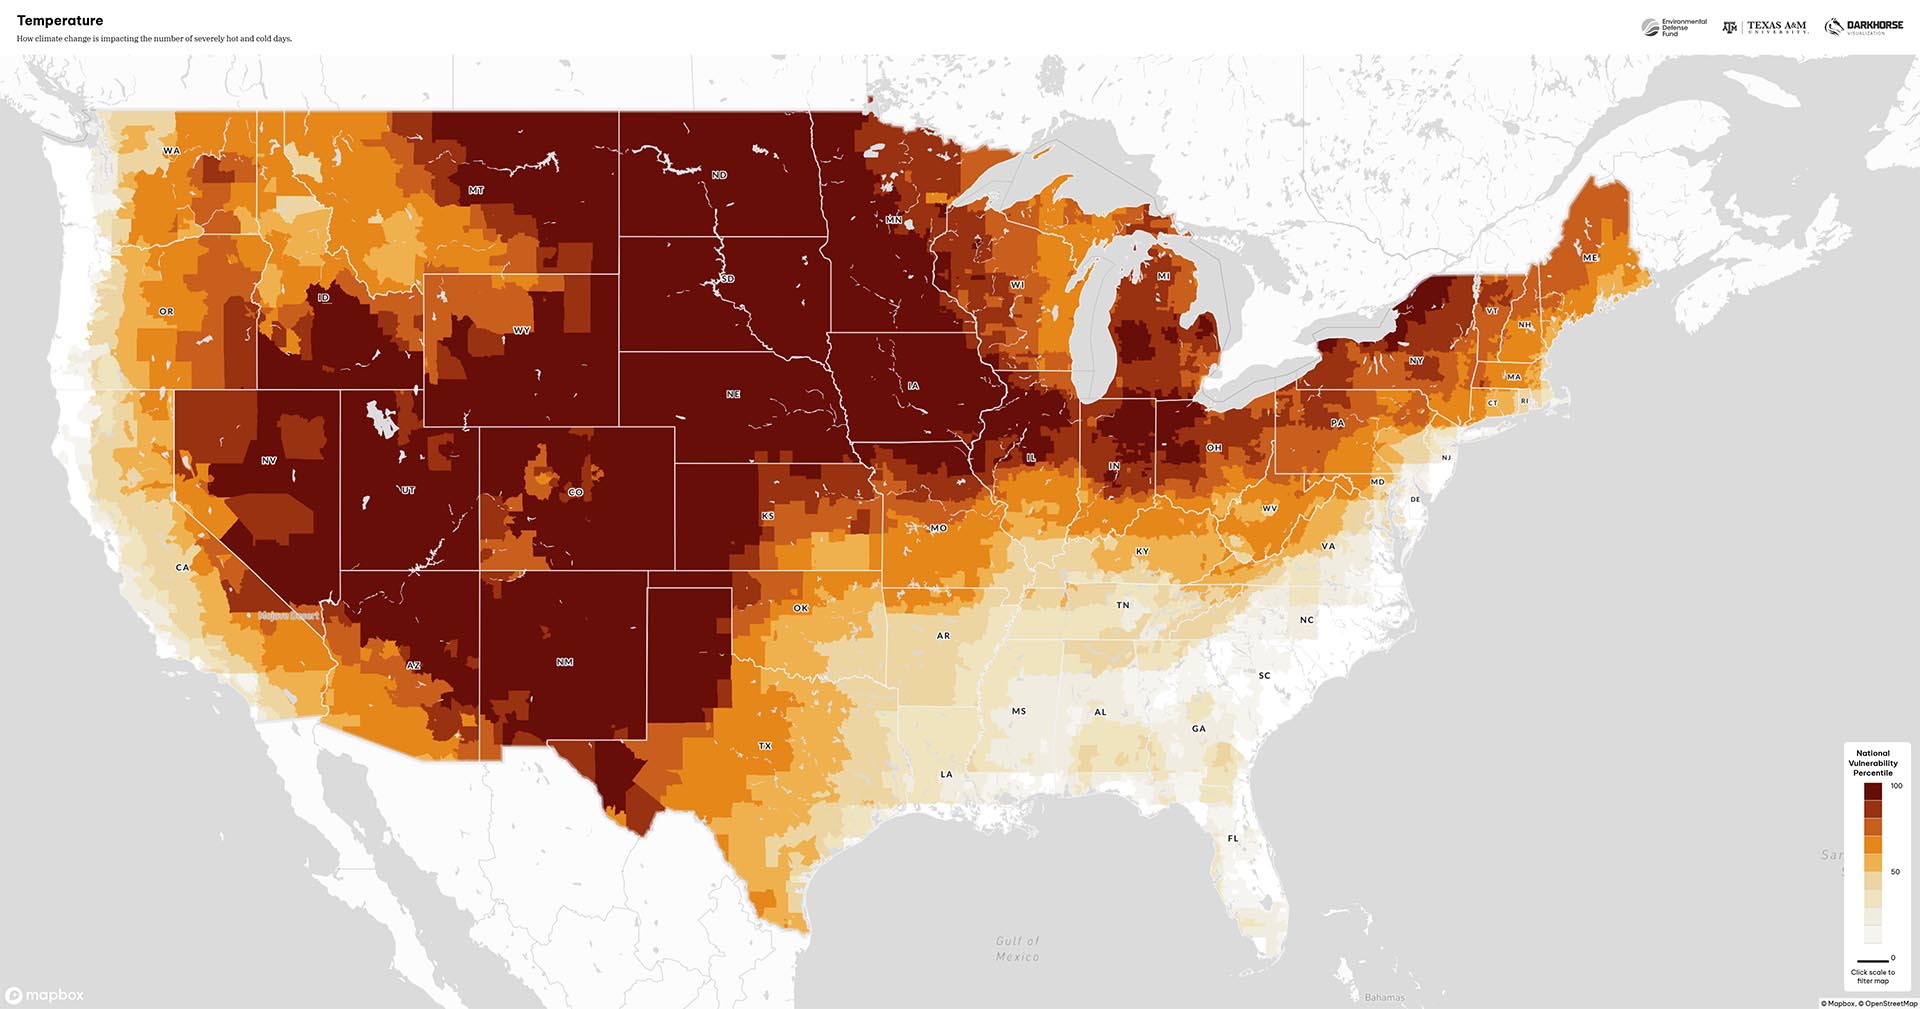
According to the National Weather Service, extreme heat is 7x more deadly than cold,3 so we wouldn’t weight these risks equally when assessing vulnerability. We've found that the Southern & Central US (along with parts of California and Arizona) are most at risk from extreme heat.
The CVI also counts total precipitation and snowfall under Extreme Events, whereas we generally view high precipitation as a good indicator of resilience. Flooding as a result of rainfall is a clear threat, but the CVI counts floods as a separate factor.

We wouldn’t discount a region that receives high precipitation, we would just look at property-level flood maps (such as provided by First Street)4 to ensure you’re not in the path of disaster.
The next layer under climate impacts is Health, which accounts for temperature and disaster-related deaths, air pollution-related deaths and illness, and infectious diseases. Here the data more closely mirrors our findings:
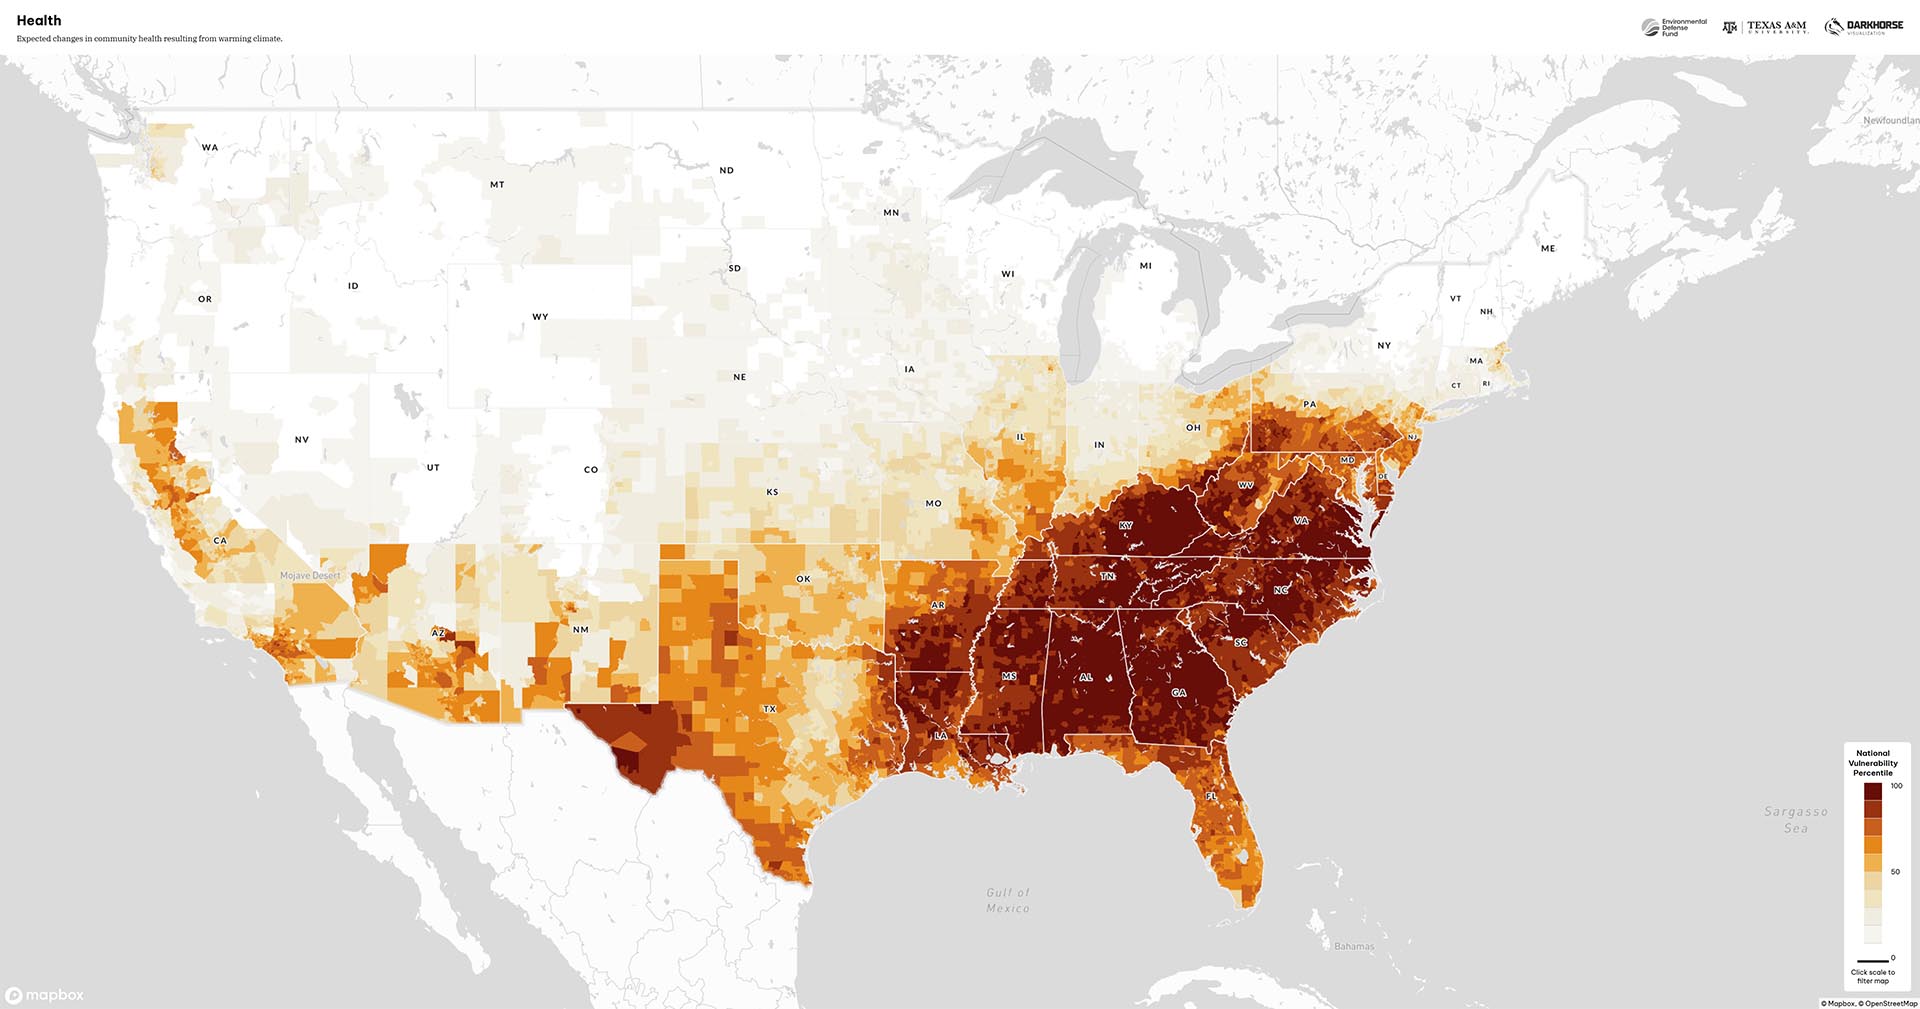
As expected, the Southeastern US is most at risk, with the exception of Infectious Diseases:

Here northern states with higher rainfall are more vulnerable, which we assume is due to the prevalence of Lyme Disease in those regions.5,6
The final layer within Climate Impacts is Social & Economic, which measures the costs of climate disasters, economic and productivity losses due to climate change, transition risks, and social stressors:

We see the most vulnerable regions concentrated in the Great Plains, with the epicenter covering Iowa, Nebraska, and South Dakota. Here we’ll once again differ from some of the CVI’s conclusions. In the case of social stressors, the CVI marks the northern US as most vulnerable:
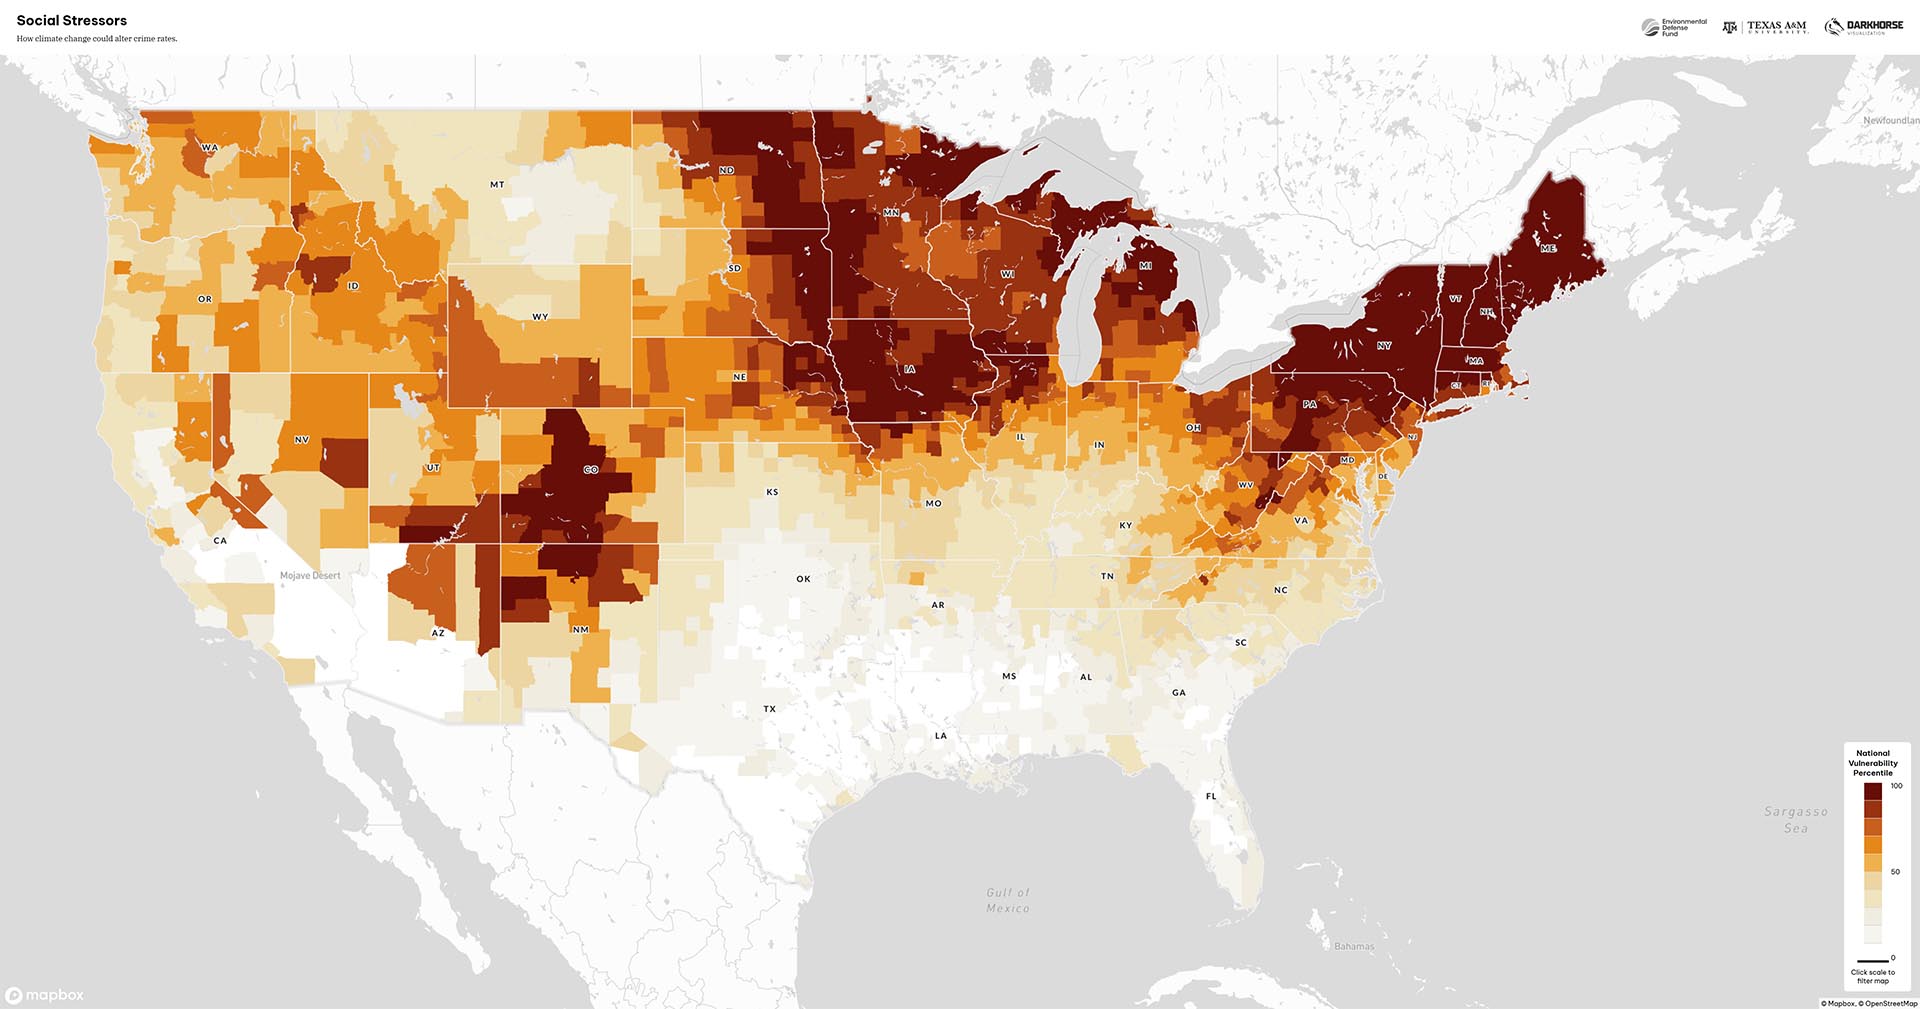
Reading more closely, we can see that this factor measures the percent change in crime due to climate change. Crime tends to increase as temperatures go up,7,8 and temperatures are projected to increase by a greater amount at higher latitudes.9 However, the absolute rate of violent crime (particularly homicide) is highest in the Southeastern US:10,11,12
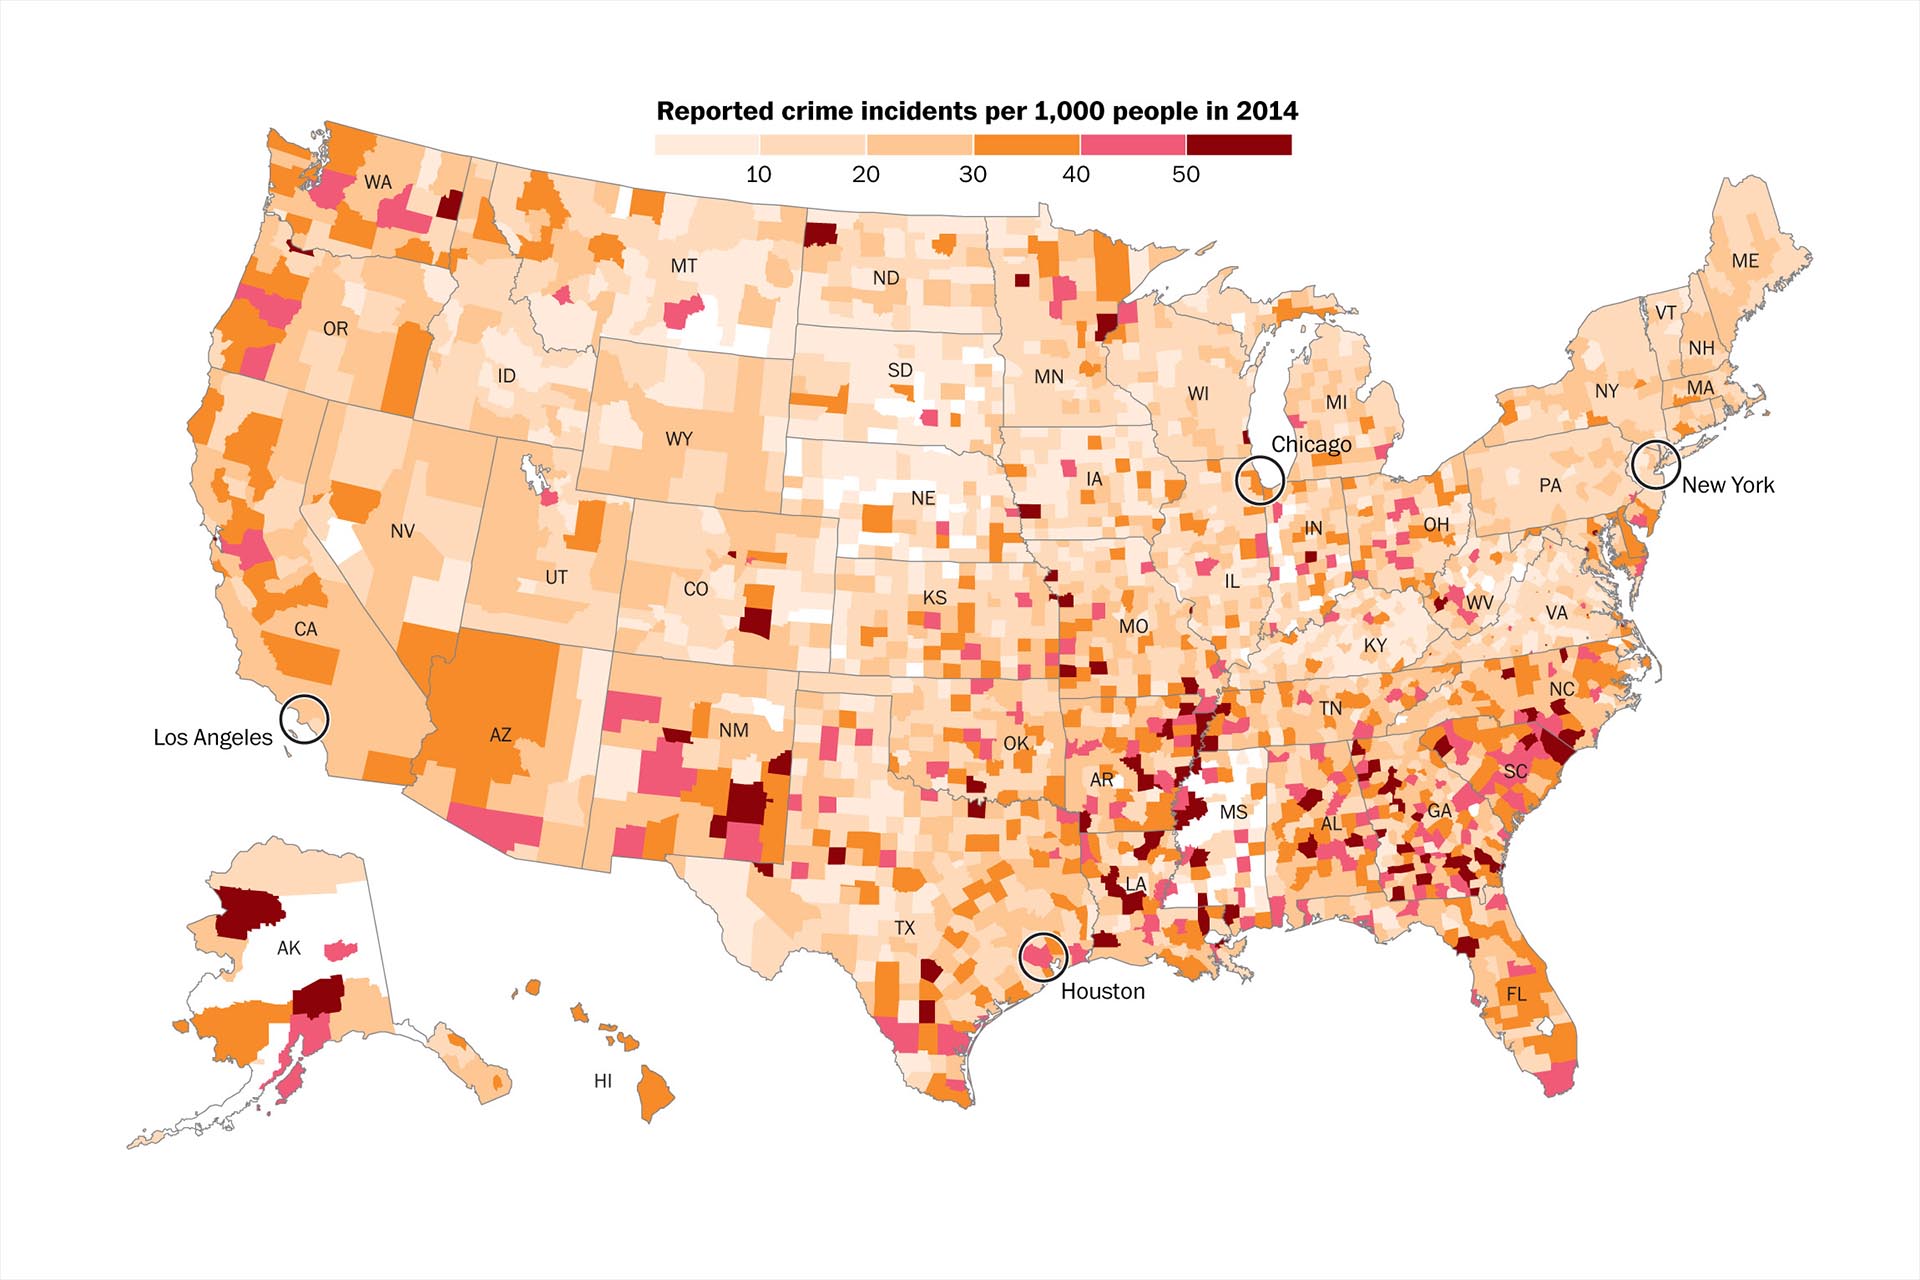
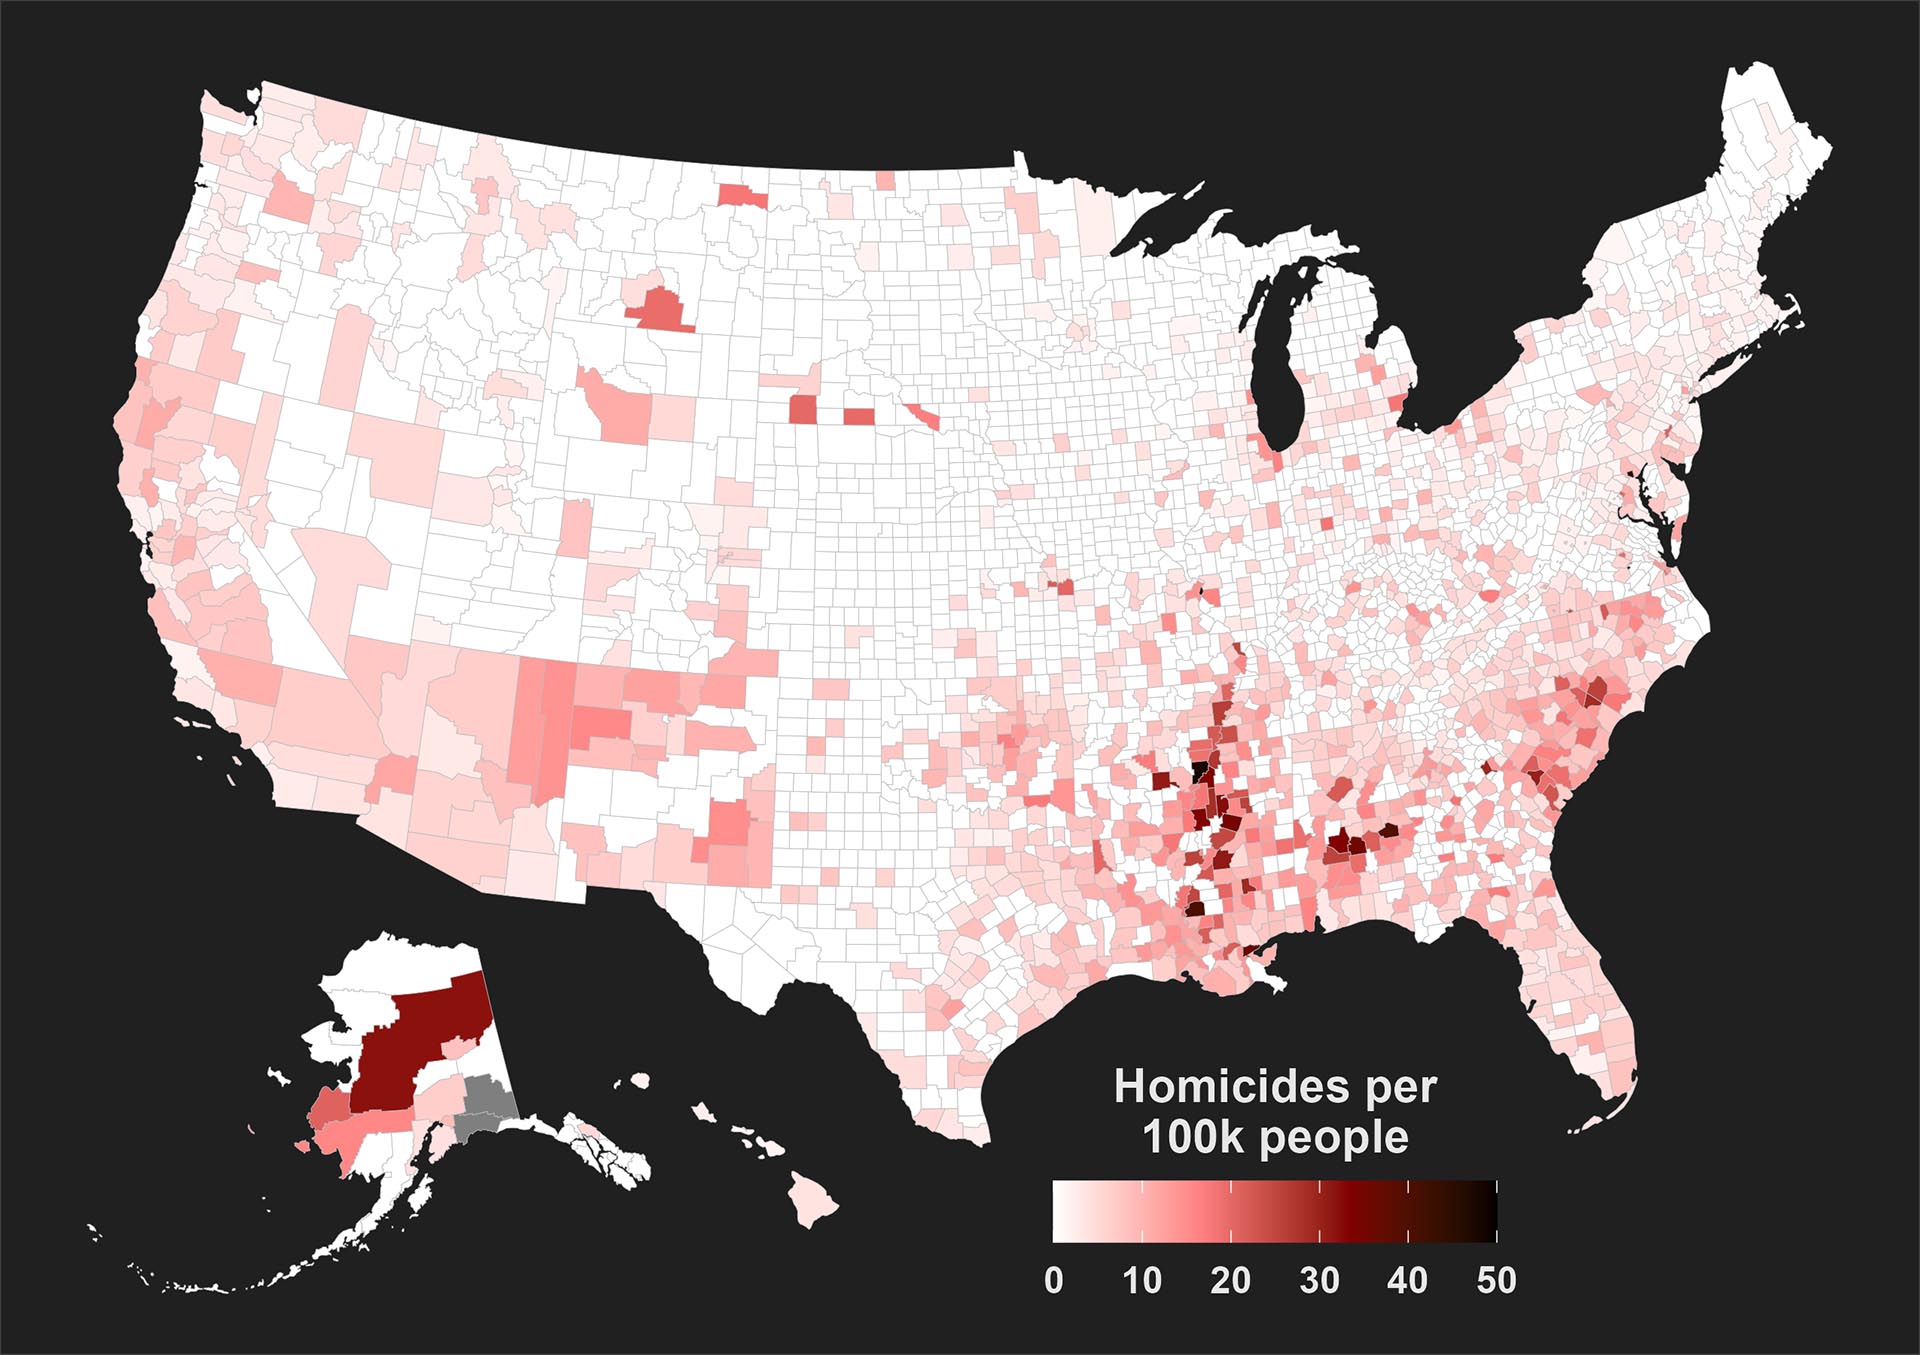
As studied by the Climate Impact Lab, violent crime in northern regions is projected to increase at most by 5% under high-emissions scenarios.13 Even accounting for that increase, violent crime will remain highest in the Southeast. When assessing a location, we’re more concerned about actual risk, not a change in risk.
We could continue picking apart this data, but at this point it should be clear that we shouldn’t accept any compound risk rating at face value; we need to dig a little deeper and see what it’s actually measuring. As we stated earlier, our overall take is that the Climate Vulnerability Index should not be used as a primary resource if you’re looking to avoid the physical risks of climate change.
That said, we don’t believe the CVI is poorly thought-out, or that its authors came to incorrect conclusions. The CVI is primarily a tool for assessing community resilience, and it does a great job at that. So let’s take a look at the second layer of the map, which covers that in depth.
Community Baseline
The Community Baseline section of this map builds on the CDC’s Social Vulnerability Index, which we’ve archived here. As stated in the methodology:
Baseline vulnerability indicators reflect factors that may reduce resilience. These were divided into four categories: Health, Social & Economic, Infrastructure, and Environment.
The CDC/ATSDR Social Vulnerability Index (SVI) underlies more than half of indicators in the Social & Economic domain, but were augmented by additional indicators such as redlining designations in urban areas, additional vulnerable populations (e.g., homeless, Veterans), crime and prison statistics, housing characteristics, and presence/lack of non-governmental organizations.14
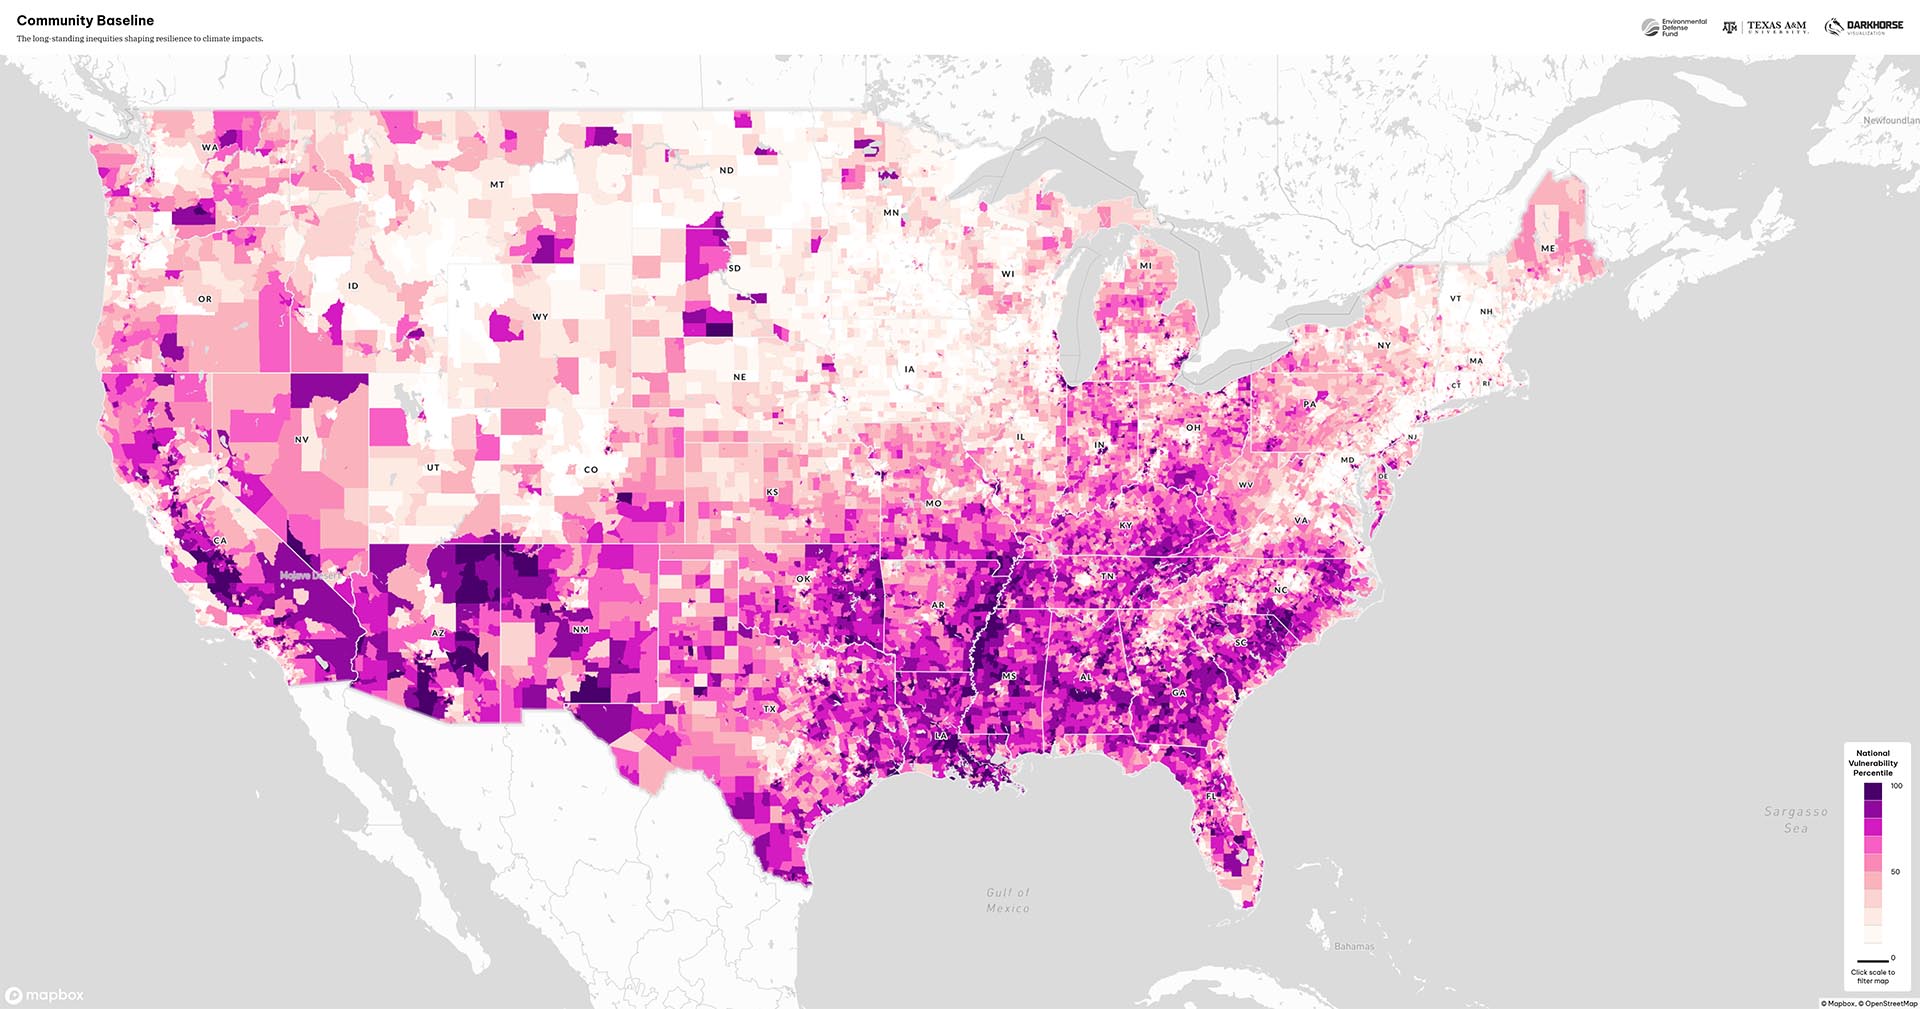
The SVI is a great resource, so we were glad to see the CVI expand on it. This data layer generally mirrors other measures of resilience (such as CRSI and BRIC)15,16 and shows the Southern US as most vulnerable:
Layers for Health and Infrastructure look similar, which we assume is due to greater poverty and socioeconomic disparities in those regions:17,18,19

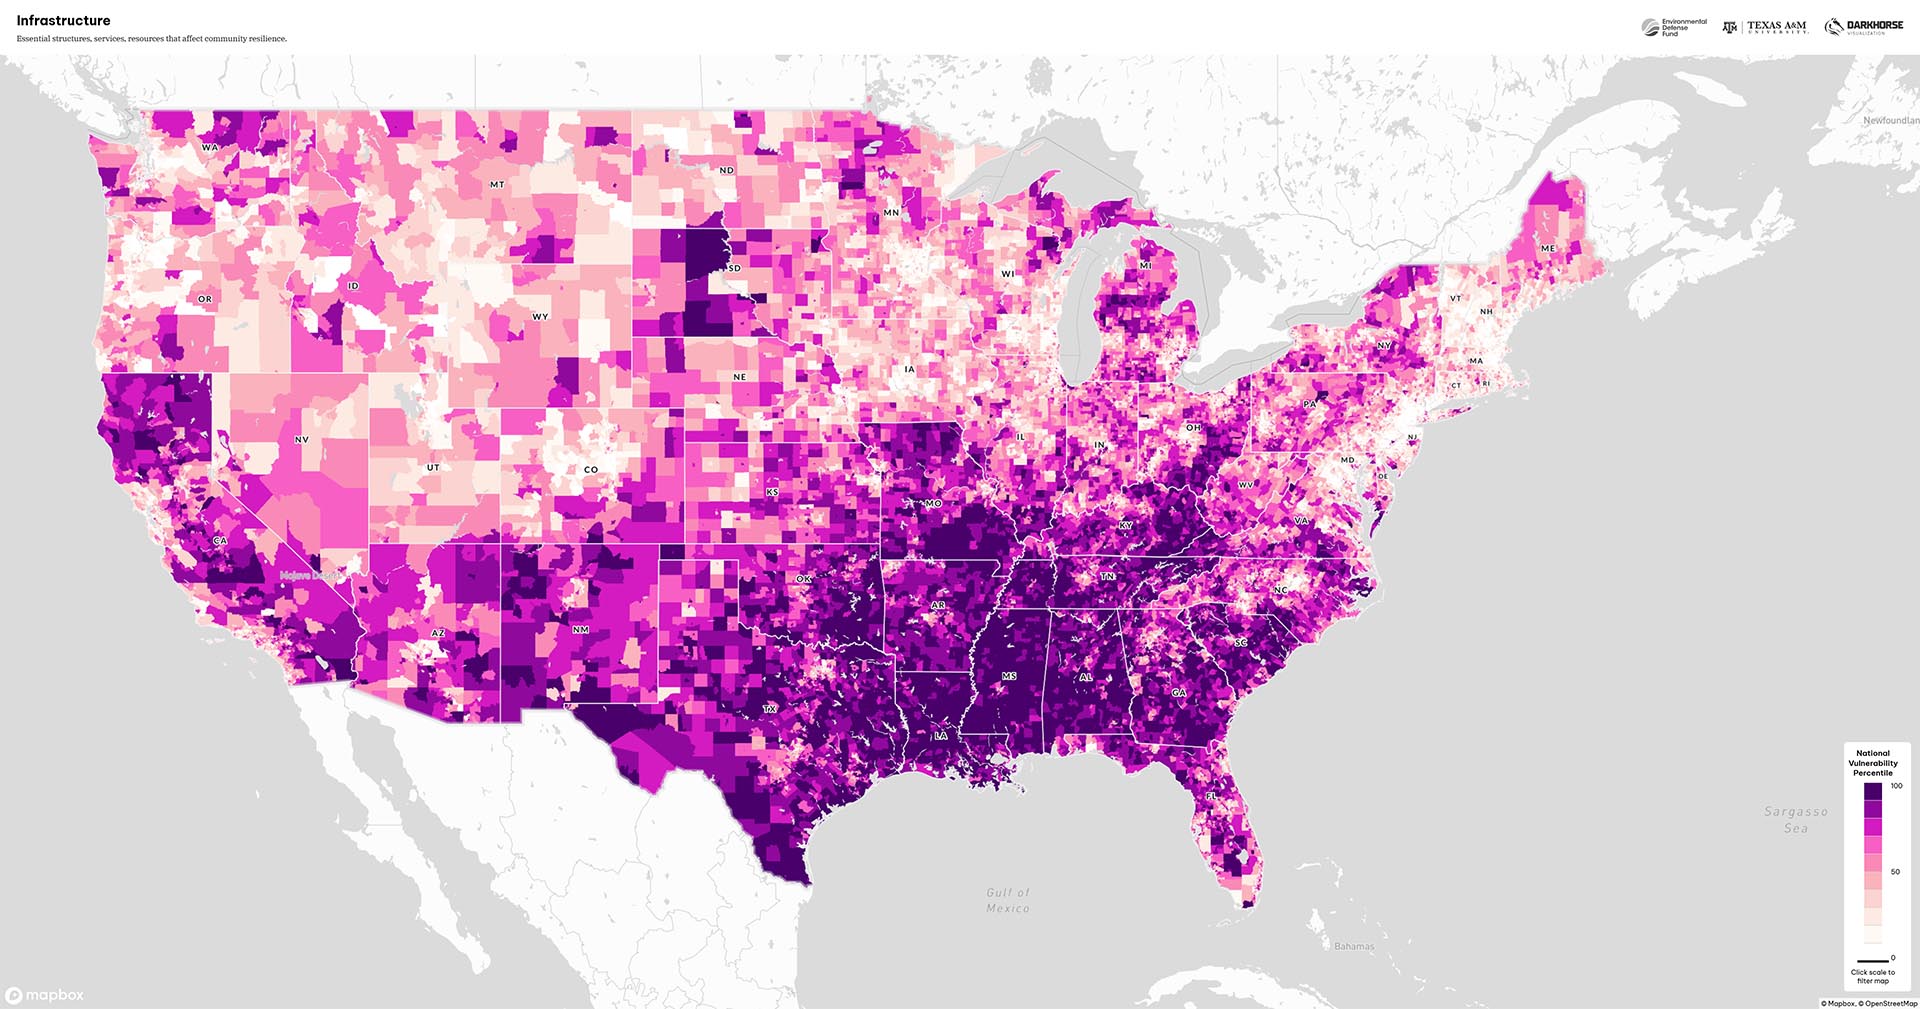
Health measures chronic disease, physical health, mental health, child and maternal health, and access to care and prevention; Infrastructure measures transportation, financial services, food and waste management, energy and utilities, communications, and governance.
The Social & Economic layer shows highest vulnerability in the Southwest and Western states:
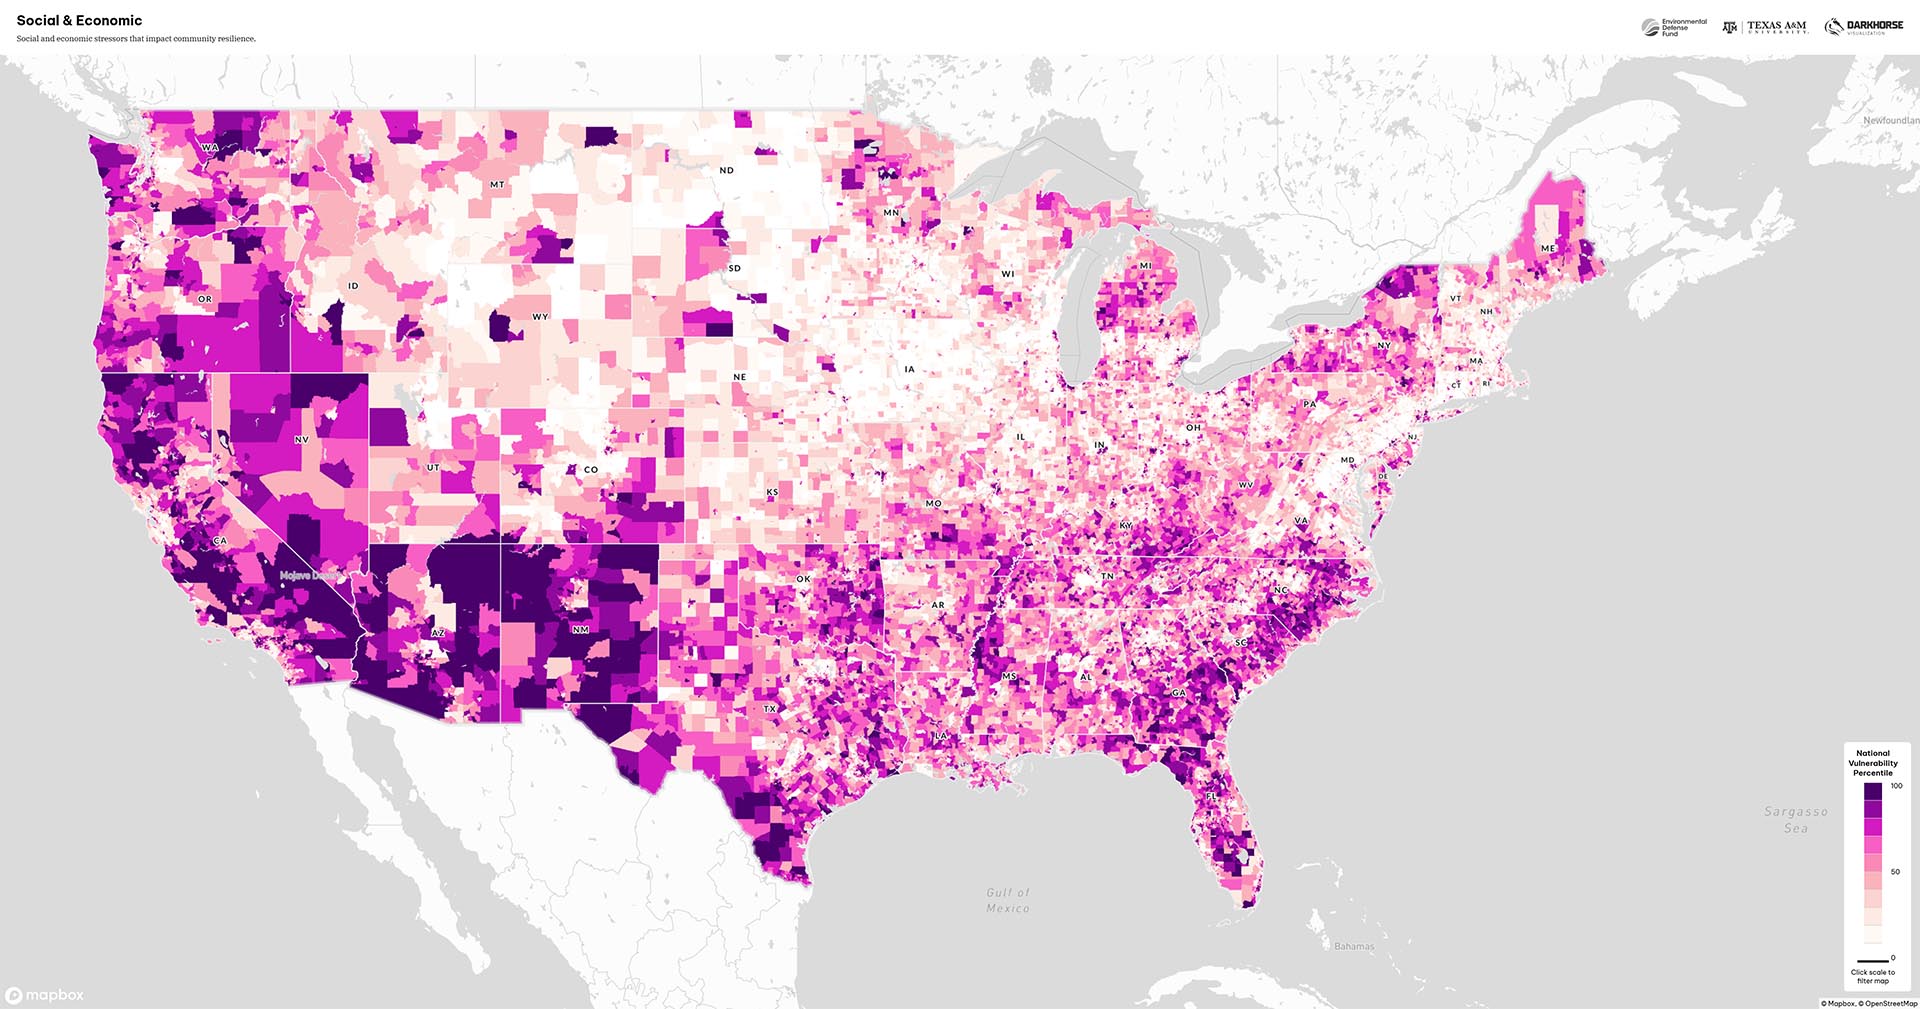
This layer measures socioeconomic stressors (such as income, unemployment, education, and crime), as well as demographics and housing composition.
Environmental Vulnerability largely tracks with population density:
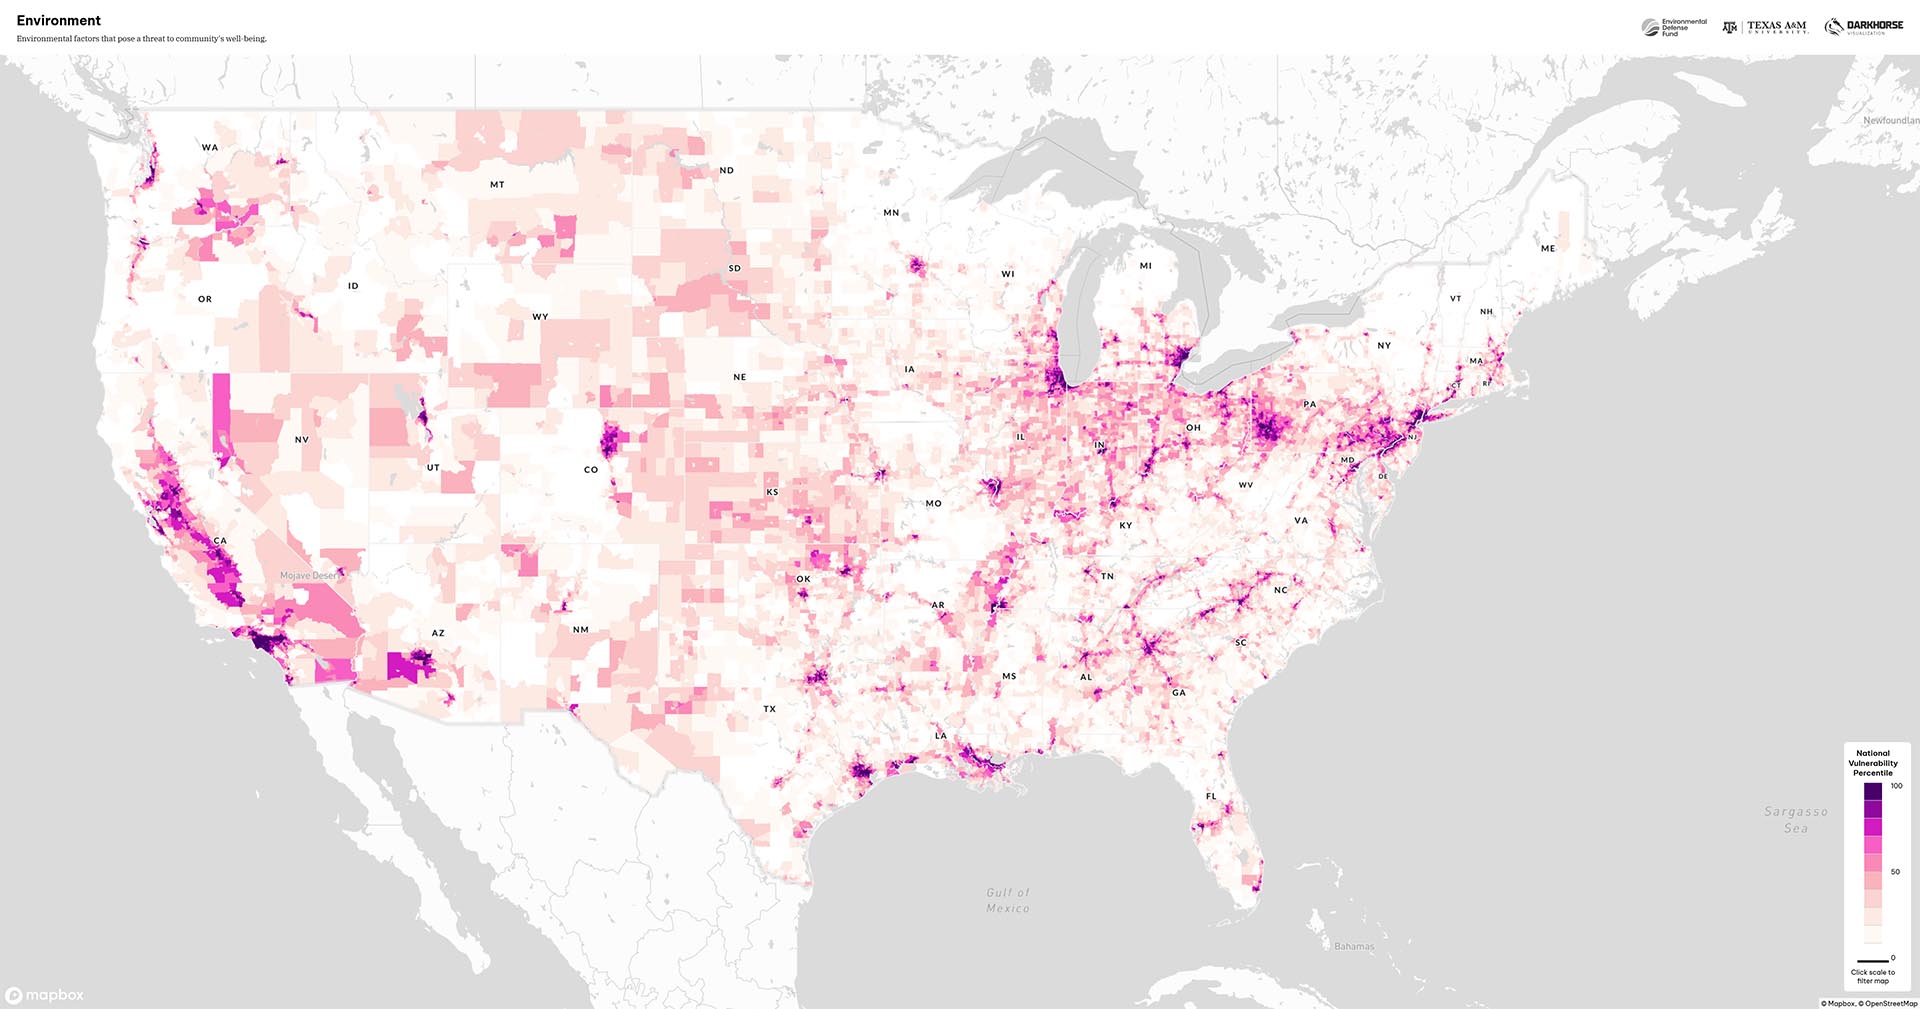
This is likely due to the fact that urbanization decreases the physical resilience of an environment.20 Heat islands increase temperatures in cities,21 impermeable surfaces lead to greater flood risk,22 air, water and soil pollution is higher,23,24,25 and biodiversity losses are greater.26,27
How We’d Use this Data
Despite all our caveats, the overall picture ends up mirroring our conclusions: that broadly speaking, the southern half of America is facing the most risk from climate change, while the northern half is generally a more resilient option.
While we wouldn’t use it as a primary tool, the Climate Vulnerability Index is a great complement to other resources. If we were looking for a place to move, we’d start with our series on climate havens, and use our collection of risk maps to narrow down our options. Once we’d settled on a handful of areas, we’d plug them into the CVI and see how they compare. We’d only select the Community Baselines layer, and we’d use that to make a final pass after we’ve identified places that are more physically safe.
If you’d rather save yourself that work (or just see what results we came up with), we used a similar process to create our guide to the regions and cities that are best-placed to survive in a warming world. We’ve also written a walkthrough for the National Risk Index, which is another good tool for evaluating risk.
Whether you make use of our guides or run the numbers yourself, we hope this helps you understand what to look for when you have a risk map in front of you, and how to use that data in your search for a more resilient location.
Footnotes & References
- Methodology (U.S. Climate Vulnerability Index)
- FAQ (U.S. Climate Vulnerability Index)
- Weather Related Fatality and Injury Statistics (National Weather Service)
- U.S. Flood Model Methodology (First Street)
- Impact of prior and projected climate change on US Lyme disease incidence (Lisa Couper, Andrew MacDonald, Erin Mordecai, Global Change Biology)
- Tick-Borne Diseases Risk Increasing Due to Climate Change (Joel Brown, Boston University)
- Temperature, violent crime, climate change, and vulnerability factors in 44 United States cities (Seulkee Heo, Hayon Michelle Choi, Jesse Berman, Michelle Bell, Environment International)
- Temperature, Crime, and Violence: A Systematic Review and Meta-Analysis (Hayon Michelle Choi, Seulkee Heo, Damien Foo, Yimeng Song, Rory Stewart, Jiyoung Son, Michelle Bell, Environmental Health Perspectives)
- Climate Change: Regional Impacts (UCAR)
- Here’s what crime rates by county actually look like (Dan Keating, Denise Lu, The Washington Post)
- List of U.S. states by intentional homicide rate (Wikipedia)
- The Highest Rates of Gun Homicides Are in Rural Counties (Chandler Hall, Center for American Progress)
- Estimating economic damage from climate change in the United States (Solomon Hsiang, Robert Kopp, Amir Jina, James Rising, Michael Delgado, Shashank Mohan, D. J. Rasmussen, Robert Muir-Wood, Paul Wilson, Michael Oppenheimer, Kate Larsen, Trevor Houser, Science)
- Characterizing vulnerabilities to climate change across the United States (P. Grace Tee Lewis, Weihsueh Chiu, Ellu Nasser, Jeremy Proville, Aurora Barone, Cloelle Danforth, Bumsik Kim, Jolanda Prozzi, Elena Craft, Environment International)
- Development of a Climate Resilience Screening Index (James Kevin Summers, EPA)
- Baseline Resilience Indicators for Communities (University of South Carolina)
- Mapping social vulnerability in southeastern states and the Gulf Coast (Oxfam)
- The Justice Gap: The South (Legal Services Corporation)
- The South’s high poverty rates and low economic mobility are the result of racist, anti-worker policies (Economic Policy Institute)
- Unraveling the urban climate crisis: Exploring the nexus of urbanization, climate change, and their impacts on the environment and human well-being (Sumanta Das, Malini Roy Choudhury, Bhagyasree Chatterjee, Pinanki Das, Sandeep Bagri, Debashis Paul, Mahadev Bera, Suman Dutta, AIMS Public Health)
- Urban Heat Islands (UCAR)
- How does increasing impervious surfaces affect urban flooding in response to climate variability? (Wonmin Sohn, Jun-Hyun Kim, Ming-Han Li, Robert Brown, Fouad Jaber, Ecological Indicators)
- Urban vs Rural Air Quality (Met Office)
- Challenges of water contamination in urban areas (Nirankar Singh, Twinkle Poonia, Samarjeet Singh Siwal, Arun Lal Srivastav, Harish Kumar Sharma, Susheel Mittal, Current Directions in Water Scarcity Research)
- Urbanization accelerates soil degradation in peri-urban compared to rural farms (Salar Rezapour, Amin Nouri, Maedeh Shokohi, Parisa Alamdari, Scientific Reports)
- Biodiversity impacts and conservation implications of urban land expansion projected to 2050 (Rohan Simkin, Karen Seto, Robert McDonald, Walter Jetz, PNAS)
- Urbanization, Biodiversity, and Conservation (Michael McKinney, BioScience)