
Viewing Your Maps
This guide contains a collection of interactive maps covering a wide range of environmental and social risk factors. We're using choropleths† to turn complex data sets into clear visualizations that allow you to see the overall trends at a glance.
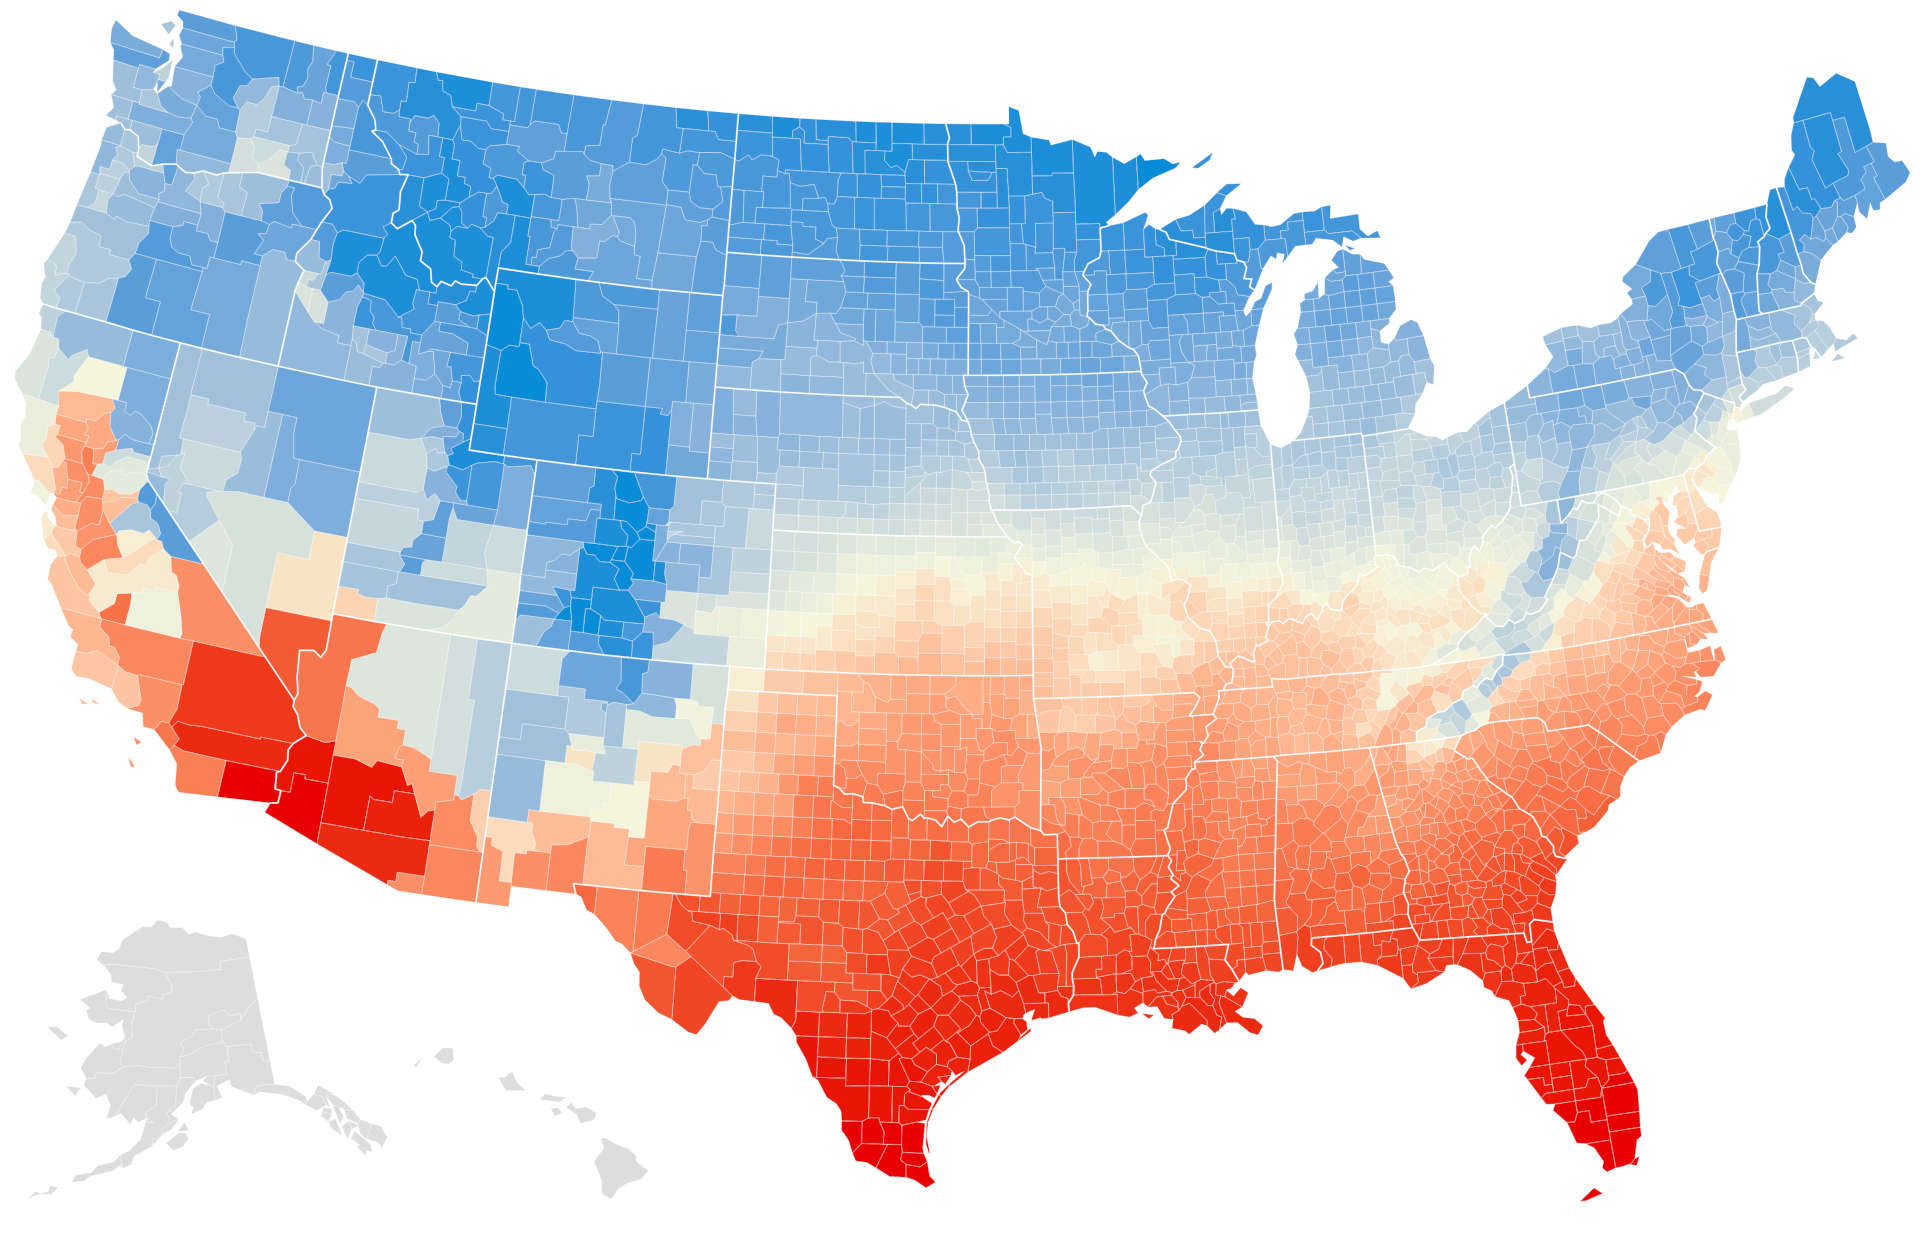
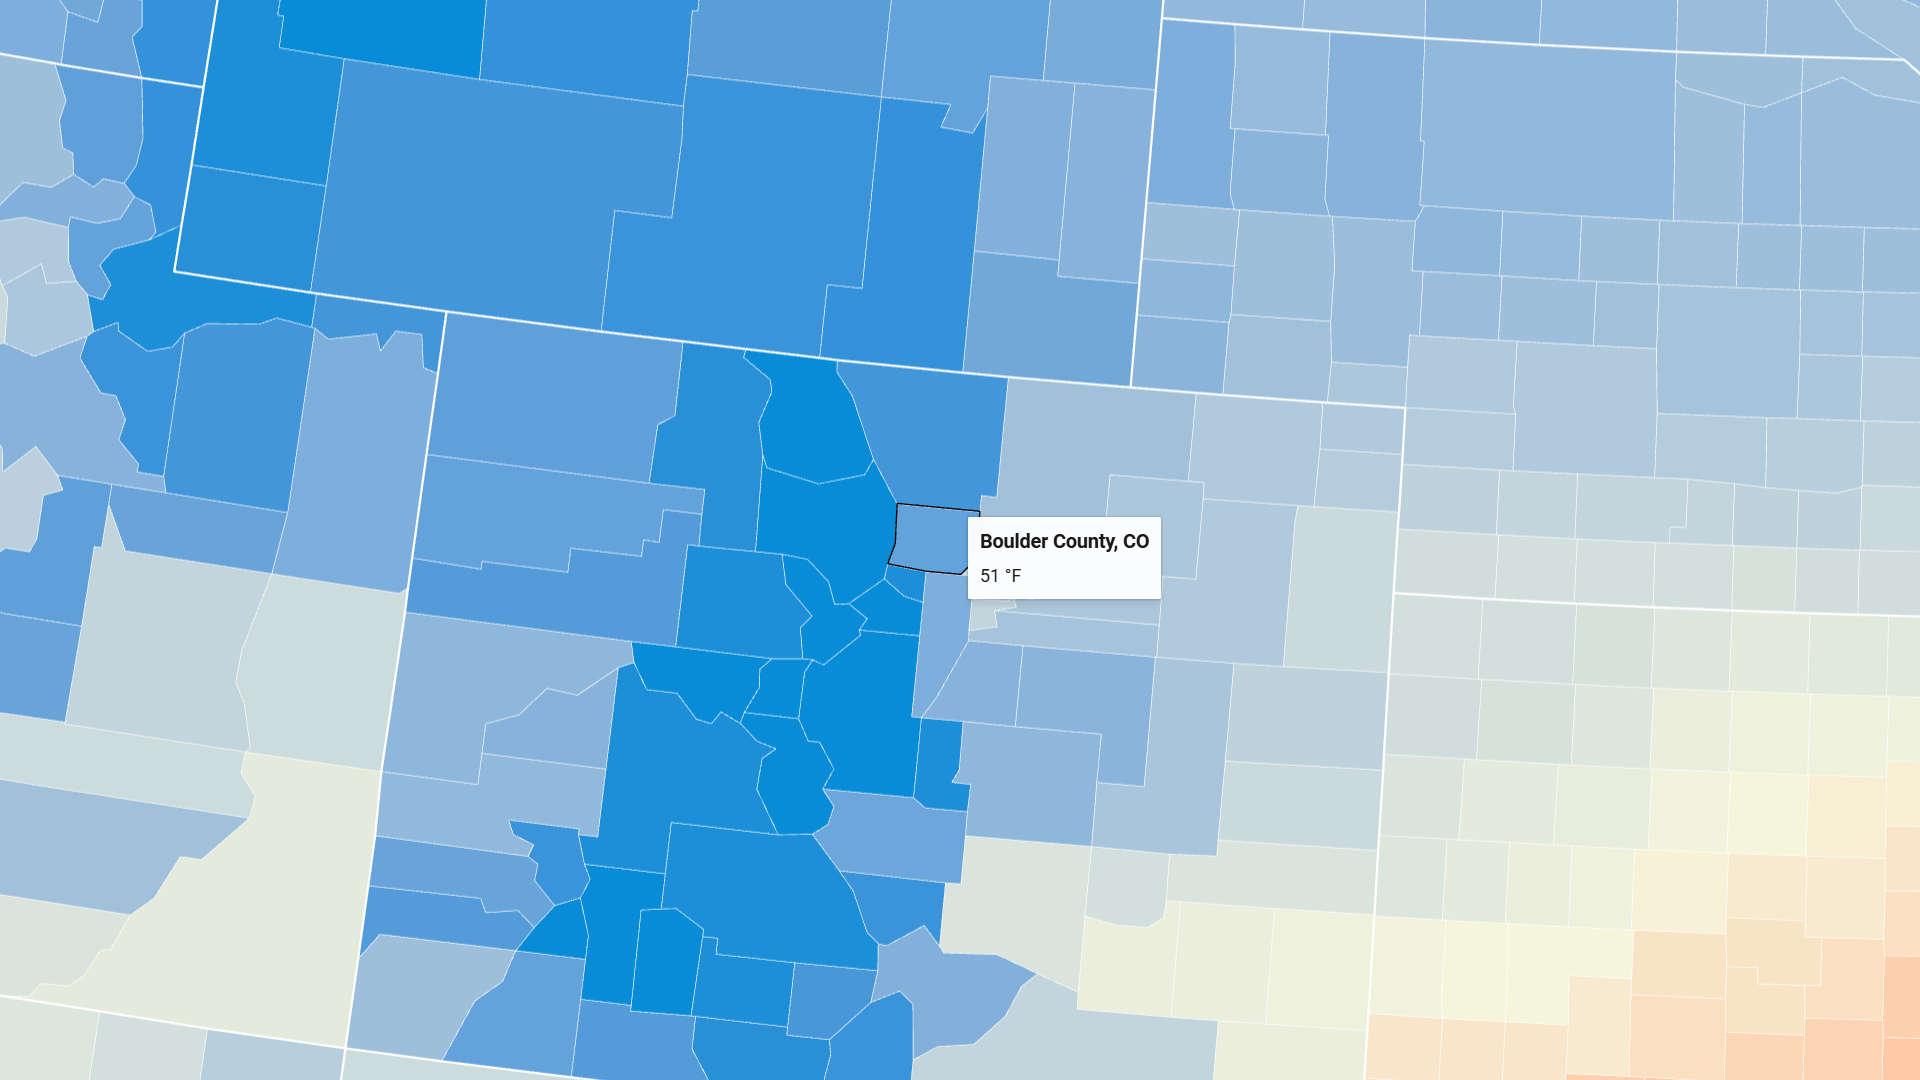
Hovering your mouse cursor over the map will display a tooltip with the county name and data value. You can use the plus/minus buttons to zoom in and out of the map, and use your mouse to drag the map around. We recommend viewing these maps on a tablet, laptop, or desktop computer, as they'll be difficult to navigate on a phone.
Reading the Data
When possible, the tooltip will display an exact data value for the corresponding risk factor. For other maps, we've converted the data into percentile rankings,† which show the relative risk of a given county.
A score of 100 doesn't mean that a given event is guaranteed to occur in that area; it means that of all the counties in the US, that county is considered most at risk. Likewise, a score of 0 doesn't mean that a given event will never occur; it means that county is considered least at risk.
In practice, risk and outcome is correlated, but it's important to remember that there will always be outliers on both sides of the spectrum.
Exploring Data Sources
Underneath each map is a direct link to the data and/or study we used to create the map, as well as our reasoning behind including each risk factor in this collection. Feel free to explore those references and do your own research!
Title Tags
After each map title, we've included tags to help you quickly identify risk timelines.
[C] is for maps of current risk. These are useful for determining your current risk, and for looking for safer places to live on a shorter timescale (5-10 years). You'll find these for climate factors, natural disasters, and most socioeconomic factors.
[P] is for maps of projected (future) risk; these are useful when looking for safety on a longer timescale (>20 years). You'll find these for climate factors, natural disasters, and certain socioeconomic factors.
What's "annualized frequency"?
Maps created using data from the National Risk Index (NRI) have 2 versions for each factor; one showing the annualized frequency, and one showing the risk score. "Annualized frequency" is defined by the NRI as:
the expected frequency or probability of a hazard occurrence per year. Annualized frequency is derived either from the number of recorded hazard occurrences each year over a given period or the modeled probability of a hazard occurrence each year.†
In other words, it's the yearly chance a given hazard is going to occur in that area.
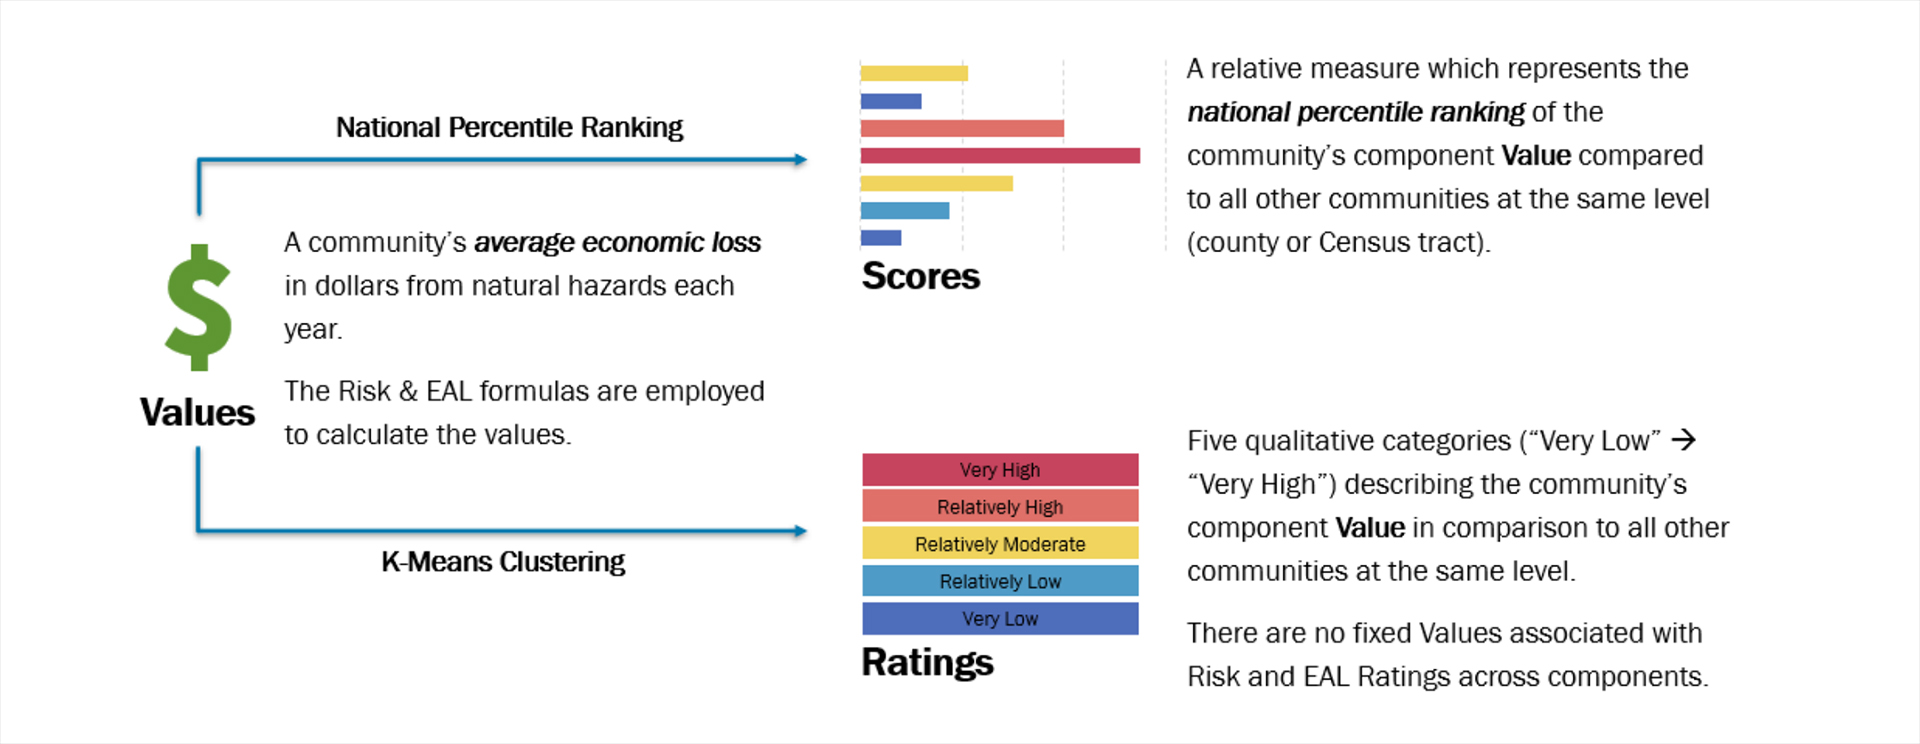
That's the information most of us are looking for, but just to be complete, we've included the risk score as well. This is a more complex calculation that includes annual losses to population, buildings, and agriculture, as well as the social vulnerability and community resilience of each county.† We think it's a useful metric to view alongside the raw risk data, as it shows the potential societal impact of a disaster.
